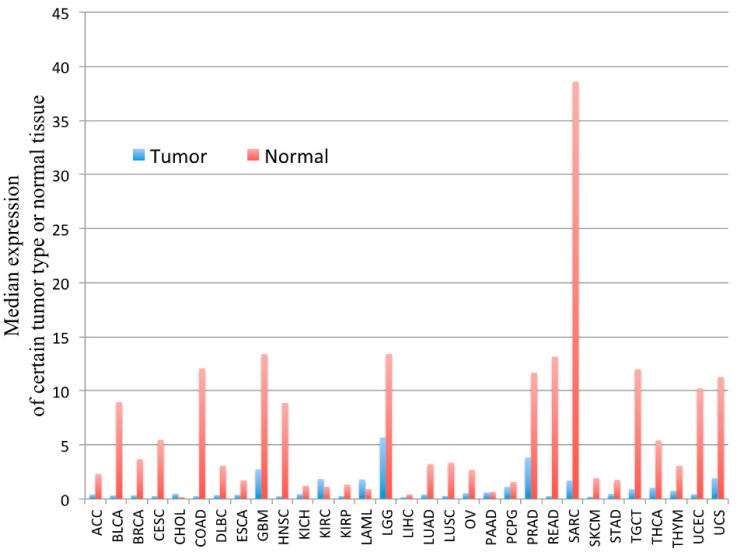
Figure 2.
The PYGM gene expression profile across tumor samples and corresponding normal tissues. The height of the bar represents the median expression of a certain tumor type (blue) or normal tissue (red). ACC—adrenocortical carcinoma, BLCA—bladder urothelial carcinoma, BRCA—breast invasive carcinoma, CESC—cervical squamous cell carcinoma and endocervical adenocarcinoma, CHOL—cholangiocarcinoma, COAD—colon adenocarcinoma, DLBC—lymphoid neoplasm diffuse large b-cell lymphoma, ESCA—esophageal carcinoma, GBM—glioblastoma multiforme, HNSC—head and neck squamous cell carcinoma, KICH—kidney chromophobe, KIRC—kidney renal clear cell carcinoma, KIRP—kidney renal papillary cell carcinoma, LAML—acute myeloid leukemia, LGG—brain lower grade glioma, LIHC—liver hepatocellular carcinoma, LUAD—lung adenocarcinoma, LUSC—lung squamous cell carcinoma, MESO—mesothelioma, OV—ovarian serous cystadenocarcinoma, PAAD—pancreatic adenocarcinoma, PCPG—pheochromocytoma and paraganglioma, PRAD—prostate adenocarcinoma, READ—rectum adenocarcinoma, SARC—sarcoma, SKCM—skin cutaneous melanoma, STAD—stomach adenocarcinoma, TGCT—testicular germ cell tumors, THCA—thyroid carcinoma, THYM—thymoma, UCEC—uterine corpus endometrial carcinoma, UCS—uterine carcinosarcoma, UVM—uveal melanoma. According to the Gene Expression Profiling Interactive Analysis, GEPIA, on-line tool www.gepia.cancer (accessed on 4 February 2021) [55].

