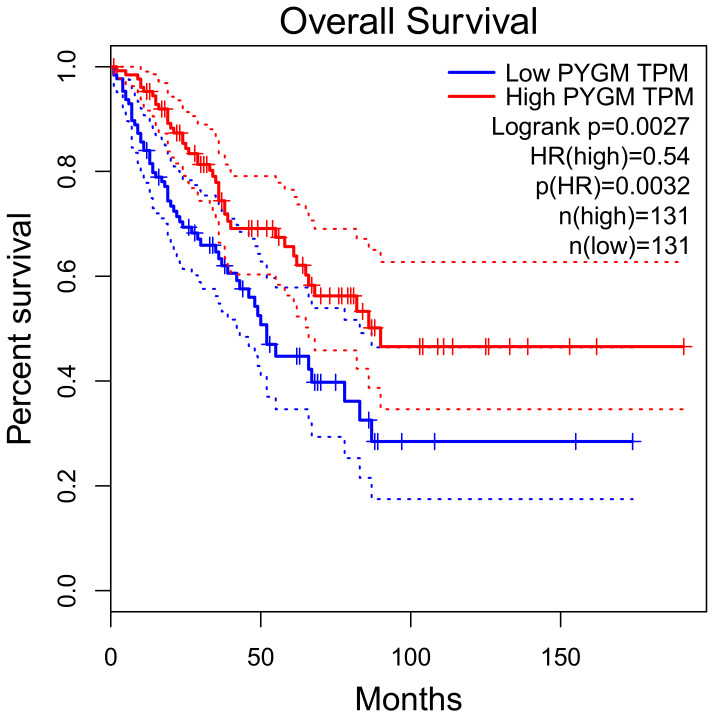
Figure 3.
Overall survival rate of patients with sarcoma, depending on the PYGM gene expression rate. Low (median) PYGM expression correlated with poorer survival. Normalized RNA-sequencing data as transcripts per million (TPM). HR—hazard ratio calculated using Cox PH Model. The solid line represents the survival curve and the dotted line represents the 95% confidence interval. According to the Gene Expression Profiling Interactive Analysis, GEPIA, available online www.gepia.cancer (accessed on 4 February 2021) [55].

