Figure 1.
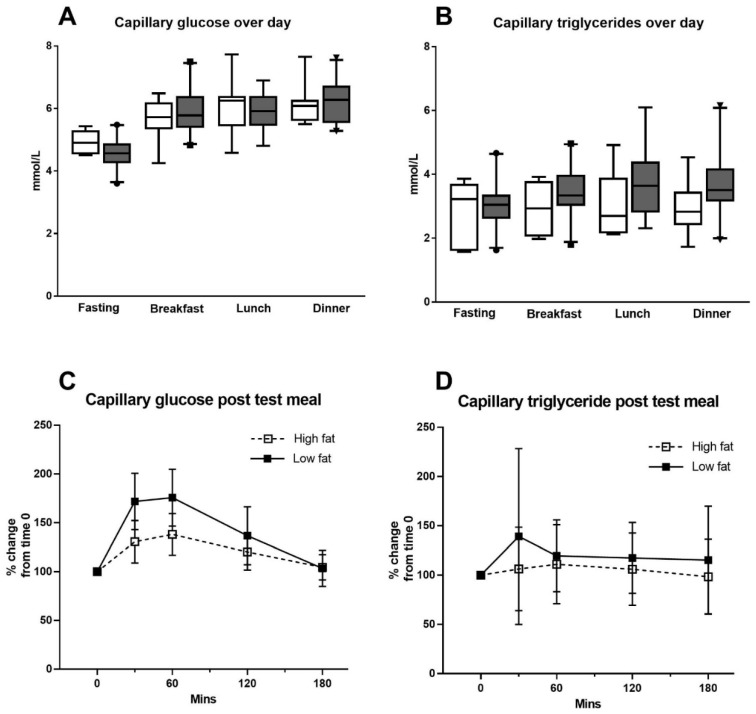
Capillary glucose and triglycerides. Levels averaged over 4 days at fasting, 2 h post breakfast, 2 h post lunch, 2 h post dinner for glucose (A) and triglycerides (B), respectively, split by GDM status. Control white, GDM grey. Data presented as box plots with 95%CI. (C) presents aggregate data for the cohort for glucose response to the high- and low-fat meals, (D) presents aggregate data for the cohort for triglycerides response to the high- and low-fat meals; mean and SD.

