Figure 5.
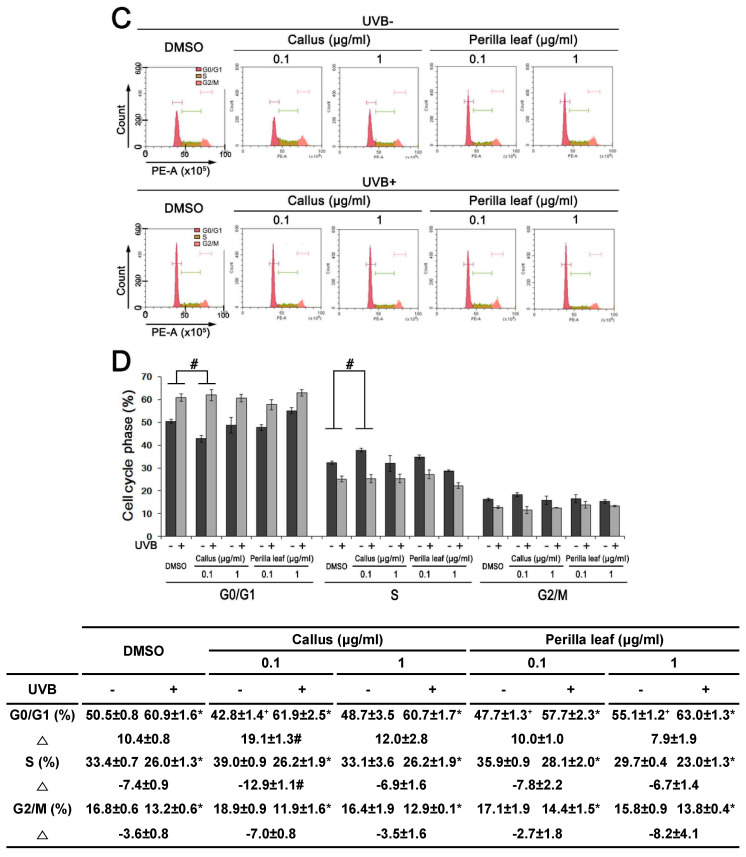
Effect of Perilla leaf and callus extracts on the cell cycle distribution of UVB exposed HaCaT cells. (A) Representative Western blot for phosphorylated checkpoint kinase 1 (pCHK1) (S345) and γH2AX proteins in HaCaT cells treated with Perilla leaf or callus extracts at 0.1 μg/mL (D: DMSO treatment; P.C; Perilla callus; P.L: Perilla leaf). β-Actin was used as the loading control. Proteins were analyzed using the Fusion image system (Fuji, Japan). Cells were treated with Perilla extracts overnight, washed with Phosphate-buffered saline (PBS), and irradiated with UVB (30 mJ/cm2), and 3 h later, pellets were harvested for Western blotting. (B) Results are presented as the means ± SDs of three biological replicates in two independent measurements (please see all images in supplementary Figure S2). * p < 0.05 versus UVB non-treated controls. # p < 0.05; versus UVB treated comparisons. (C,D) Cell cycle analysis was performed by propidium iodide staining in asynchronized HaCaT cells. The proportions of cells in different phases of the cell cycle were determined by flow cytometry. (C) Representative histograms show cell cycle distributions. HaCaT cells were subjected to fluorescence-activated cell sorting (FACS) analysis. Histograms show side scatter (SS) and forward scatter (FS) for all events. The parameters of FACS analysis are referred to as FSC-A: Forward Scatter-Area; FSC-H: Forward Scatter-Height and SSC-A: Side Scatter-A. (D) Bar chart presentations of cell cycle distributions after treatment with Perilla leaf or callus extract and UVB (30 mJ/cm2). The cell cycle distribution table shows percentages of cells in the three phases (G0/G1, S, and G2/M). Results are presented as the means ± SDs of triplicate plates per sample. * p < 0.05; significant versus UVB non-treated controls. + p < 0.05; significant versus UVB non-treated controls on G0/G1 phase. Δ; change of UVB treated from UVB untreated in each cell cycle phase. # p < 0.05; significant versus change (Δ) of DMSO treatment.


