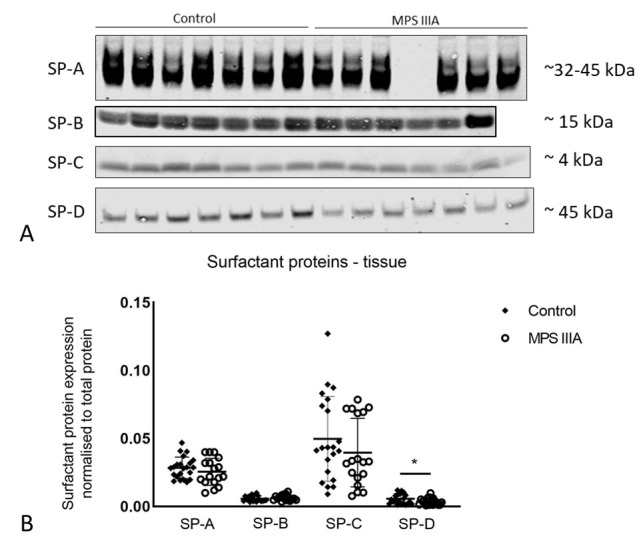
Figure 9.

Protein expression of surfactant proteins -A, -B, -C and -D. (A) Representative Western blot images of part sets of control and MPS IIIA lung tissue samples probed for SP-A (primary antibody-rabbit Thermo Scientific PA5-76699), SP-B (primary antibody-rabbit SevenHills Bioreagents WRAB-48604), SP-C (primary antibody-rabbit SevenHills Bioreagents WRAB-MSPC) and SP-D (primary antibody-rabbit Chemicon AB3434). (B) Data normalised to total protein and presented as mean ± SD; two tailed Students t-tests, * indicates a significant difference, p = 0.0443 between control and MPS IIIA mice; n = 22 control, 17 MPS IIIA (SP-A analysis); 20 control, 16 MPS IIIA (SP-B analysis); 21 control, 18 MPS IIIA (SP-C analysis) and 22 control, 19 MPS IIIA (SP-D analysis) samples. Entire band height of SP-A measured from 32–45 kDa [35].
