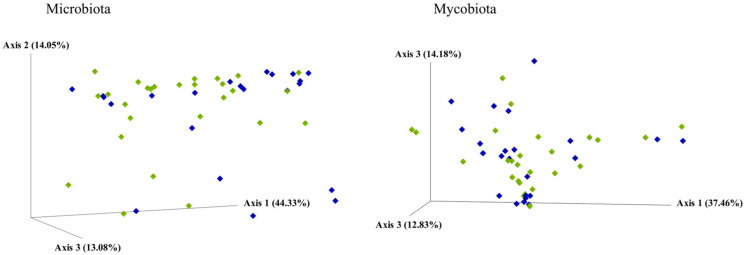
Figure 3.
Principal coordinate analysis (PCoA) based on a weight UniFrac distance matrix by response to the DBPC gluten challenge test. Participants with a positive response (NCGS) are represented by green diamonds; participants with a negative response (placebo responsive) are represented by blue diamonds.

