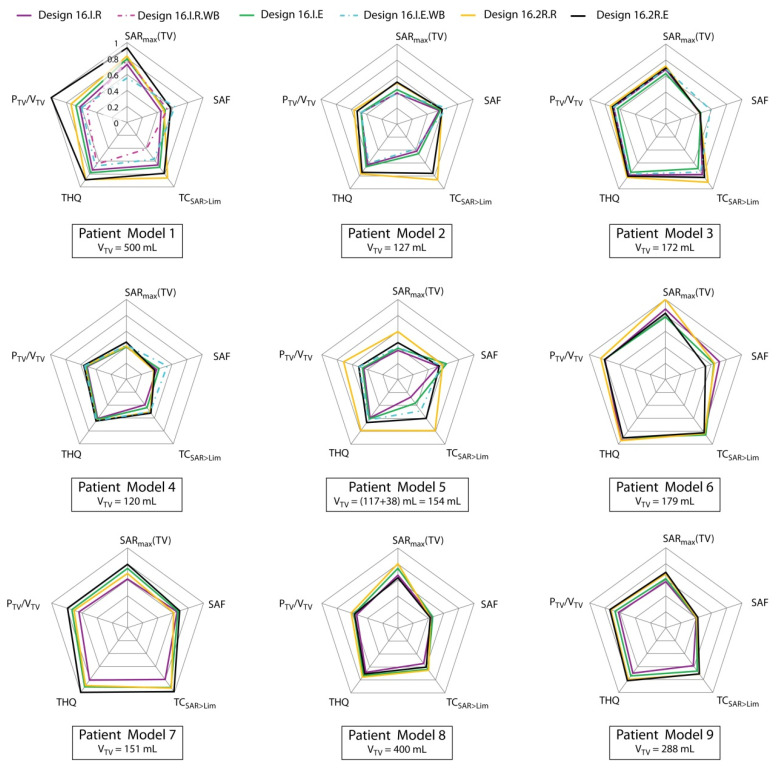
Figure 6.
Comparison of the 16 channel interleaved and two row arrays (16.I.* and 16.2R.*) for all patient models. For better comparability, all metrics were normalized to their overall maximum. Purple: 16.I.R; magenta (dashed): 16.I.R.WB; green: 16.I.E; cyan (dashed): 16.I.E.WB; yellow: 16.2R.R; black: 16.2R.E.

