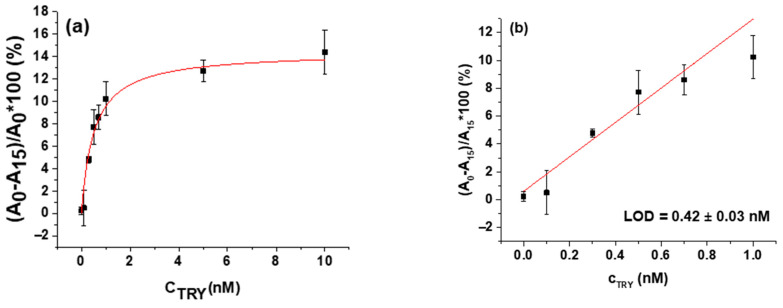
Figure 8.
Calibration plots of colorimetric assay. (a) Changes in relative values of absorbance after β-casein and MCH functionalized gold nanoparticles (AuNPs/MCH-β-casein) exposure to trypsin (A0—exposure time 0 min, A15—exposure time 15 min.) vs. concentration of trypsin (CTRY). Symbols are experimental data, and the red line is the best fit of Equation (3). (b) Linear part of the calibration curve for calculation of the limit of detection (LOD). Values are means ± SD (n = 3). Red line is the linear regression fit.

