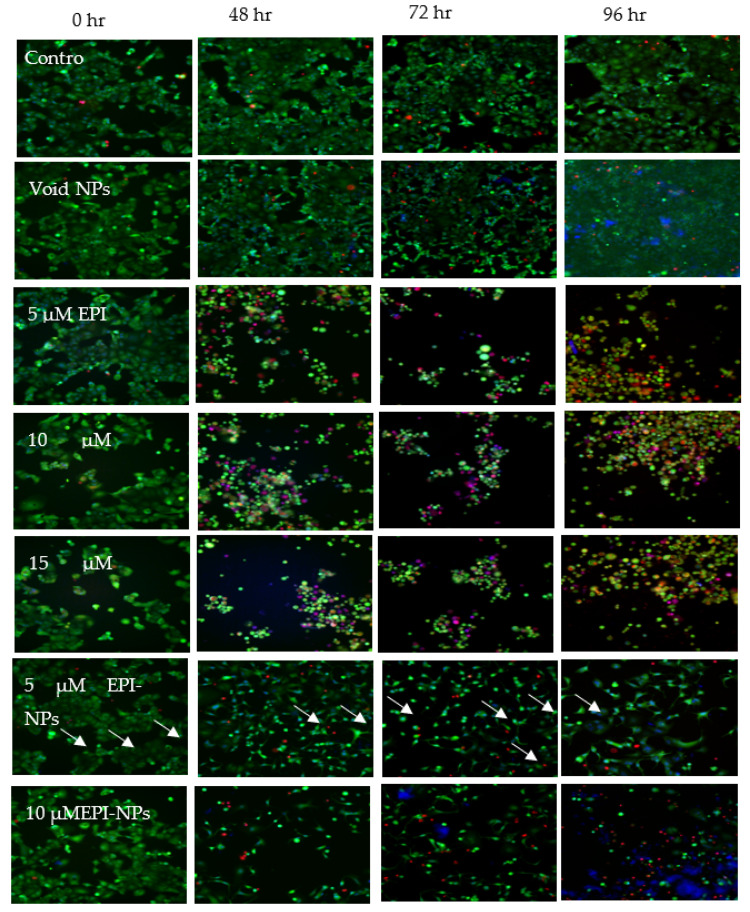
Figure 9.
Fluorescence imaging of MCF-7 cells. MCF-7 cells treated with epirubicin (5 µM, 10 µM and 15 µM), epirubicin-loaded nanoparticles (5 µM, 10 µM and 15 µM) and void nanoparticles for 0, 24, 48, 72, 96 h. After treatment, cells were stained with calcein (orange) AM (2 μg/mL), HOECHST33342 (blue) (5 μg/mL), and propidium iodide (red) (2.5 μg/mL) for 20 min. Scale bar of all images is 50 µm. The white arrows points at the condensed nuclei (blue) in apoptotic cells. The red stained cells indicate cell death detected by the propidium iodide staining. The MCF-7 cells show more apoptosis when incubated with 5 µM EPI-NPs and 10 µM EPI-NPs for 96 h, compared with the control and void NPs.

