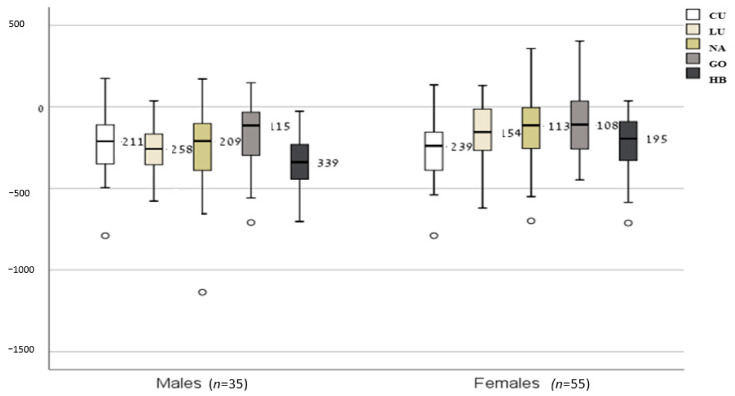
Figure 1.
Mean bias between RMRe and RMRm (kcal/day) (presented as the median and interquartile difference). Box plots showing the median differences (inner line within the box), interquartile range (IQR) (Q1–Q3), and lines indicating variability outside the upper and lower quartiles (minimum = Q1 − 1.5*IQR; maximum = Q3 + 1.5*IQR) when RMR equations were compared to measured RMR. Abbreviations: RMRm = resting metabolic rate measured; RMRe = RMR estimated by equation; HB = Harris and Benedict [8]; LU = Lührmann et al. [14]; NA = Nachmani et al. [10]; CU = Cunningham [9]; GO = Gougeon et al. [16].

