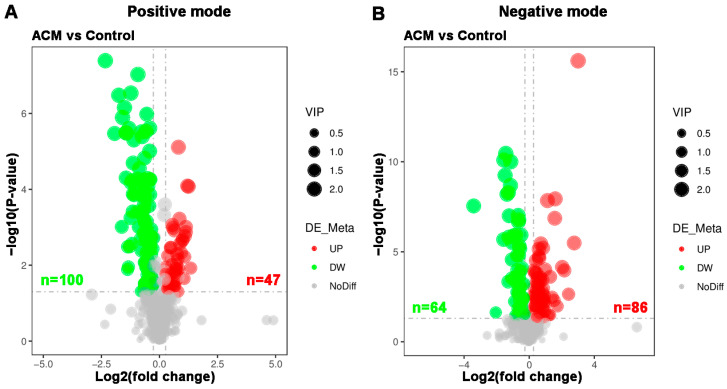
Figure 5.
Volcano plots of myocardial metabolomics data between the control and ACM groups. (A) Positive mode; (B) negative mode. Red represents upregulated metabolites, green represents downregulated metabolites, and gray represents metabolites with no difference between the two groups. The variable importance in projection (VIP) values represent the most important metabolites obtained in the PLS-DA model.

