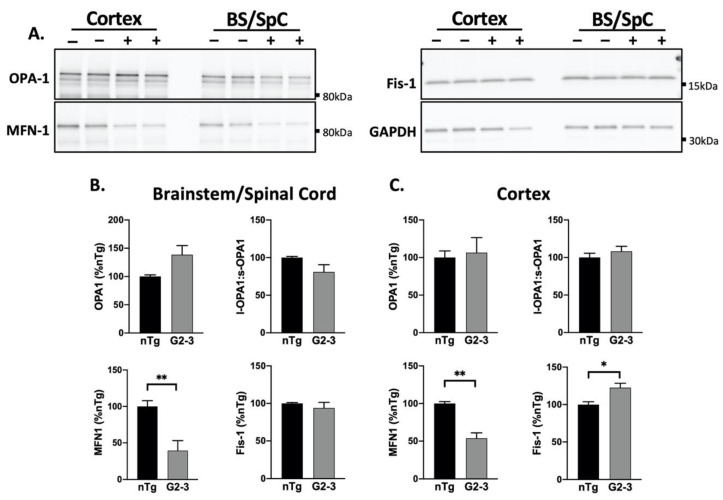
Figure 4.
Decreased MFN1 levels with A53T mutant human αS expression in vivo. (A) Western blot of mitochondrial dynamics proteins in the total brain lysate of nTg (−) and Tg (+) animals. (B,C) A quantification of immunoblots shown in (A) normalized to GAPDH, show a decrease in MFN1 levels in the BS/SpC and the Ctx (p = 0.0074, p = 0018, respectively) of the TgA53TG2-3(G2-3) samples compared to the nTg samples. In the G2-3 cortex, Fis-1 levels were also increased (p = 0.0145), per the unpaired t-tests with Welch’s correction (n = 5 per group, mean ± SEM). (* p < 0.05, ** p < 0.01).

