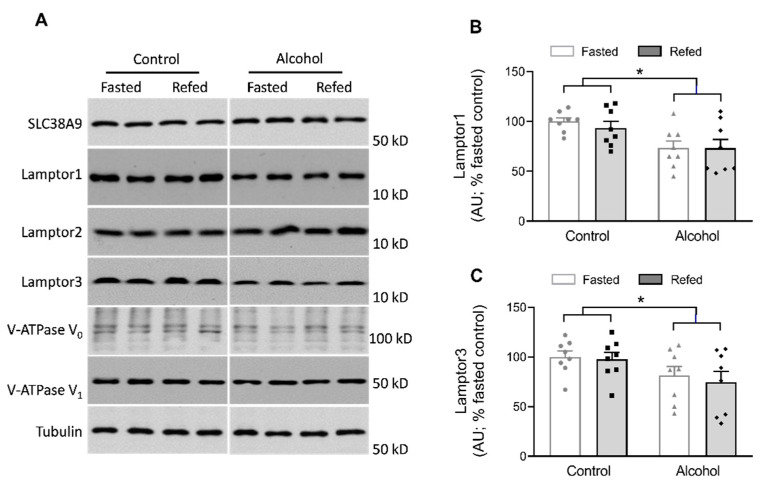
Figure 5.
Alterations in Ragulator complex subunits after refeeding in the muscles of control and alcohol-receiving mice. (A), representative immunoblots for each. With the exception of LAMPTOR1 and LAMPTOR3, none of the proteins shown demonstrated a significant (p > 0.05) alcohol effect using a 2-way ANOVA; hence, mean data are not shown. Although samples from all groups were loaded on the same gel, a gel break depicts lane(s) of the gel that have been deleted. (B,C) are bar graphs of all immunoblots for LAMPTOR1 and LAMPTOR3 that showed an alcohol effect on the abundance of these two proteins. Bar graphs represent analyses for all immunoblots, where the mean of the fasted saline-treated control group was arbitrarily set at 100 AU. Values are mean ± SEM with n = 8/group. * p < 0.05, alcohol treatment effect compared to control values.

