Figure 4.
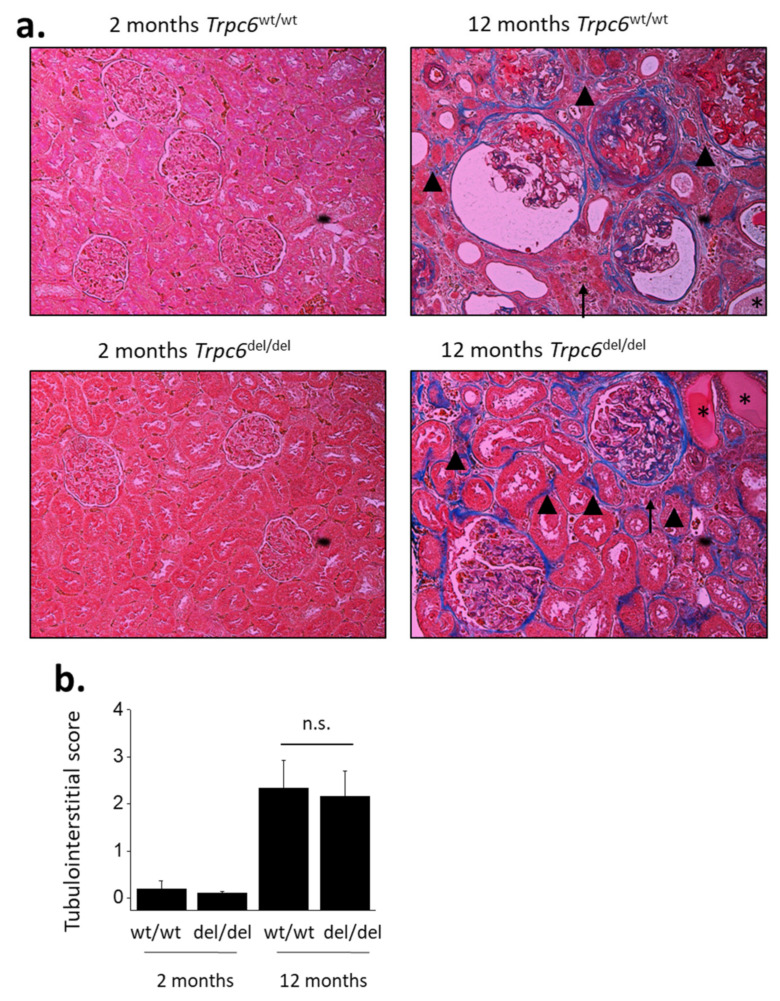
Age-related increases in tubulointerstitial disease. Representative sections stained by Masson’s trichrome method are shown in (a). Note extensive collagen (shown in blue) in 12-month-old animals, in glomeruli and in tubulointerstitial areas (arrowheads). Some of the tubules are completely hyalinized (asterisks). Note also areas of cellular infiltration (arrows). These types of images were scored semi-quantitatively by an observer blind to each treatment group for the severity of tubulointerstitial disease (b). Two-way ANOVA revealed robust effects of age on tubulointerstitial score (p < 0.001) but there was no effect of genotype and no interaction between genotype and age-related changes in this parameter. Data are from 6 animals in each group. Bar graphs show mean ± SD.

