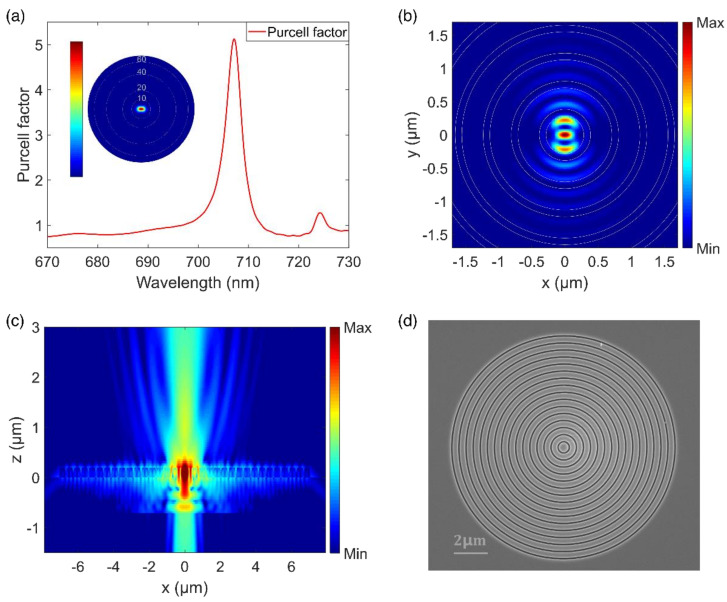
Figure 2.
(a) The simulated Purcell factor as a function of the wavelength. Inset: the far-field polar plots at the cavity resonance of 707 nm. (b) Electric field intensity distribution of CBG cavity mode in the X–Y plane. (c) Electric field intensity distribution of CBG cavity mode in the X–Z plane. (d) The top-view SEM image of the CBG.

