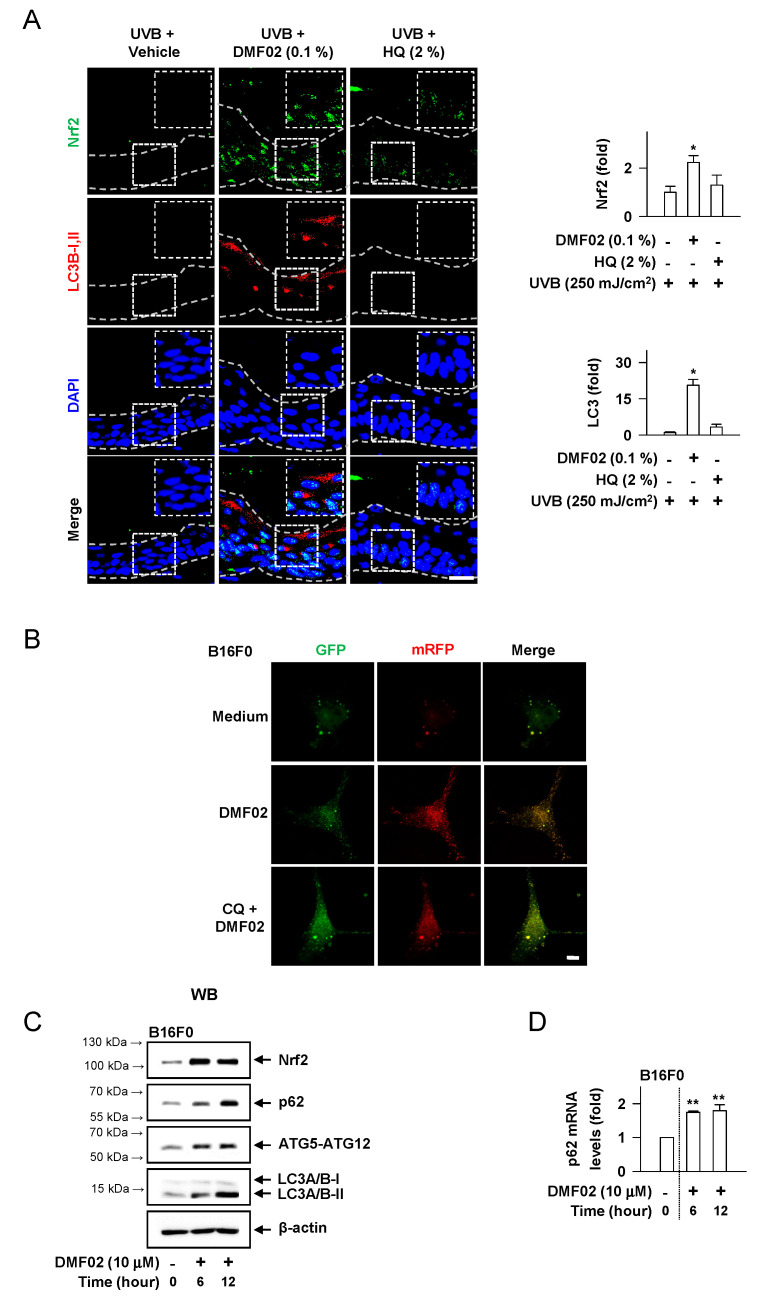
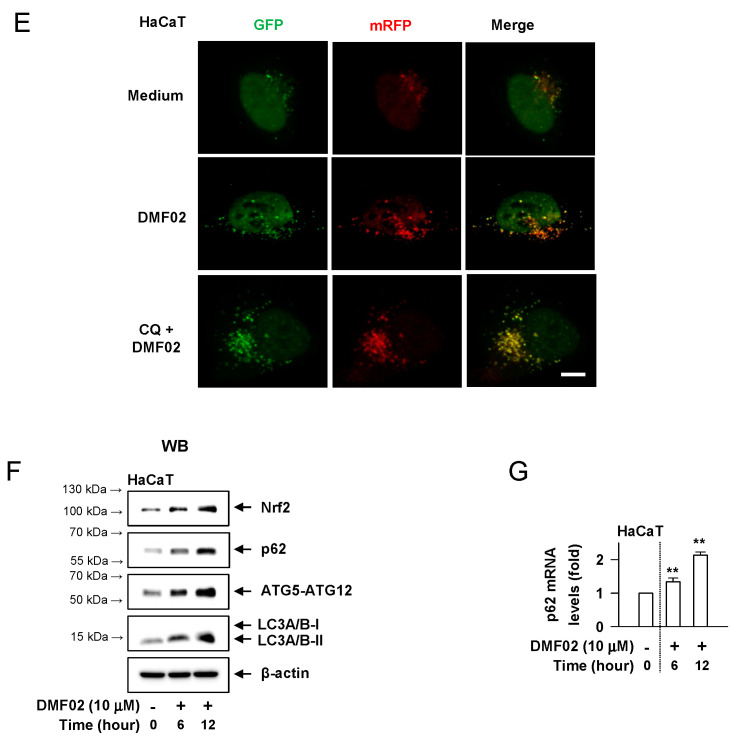
Figure 4.
Effects of DMF02 on autophagy. (A) The dorsal skin of HRM2 mice was co-stained for Nrf2 (green) and LC3B-I, II (red). Intensity of Nrf2 or LC3B-I, II was represented as a relative fold. Scale bar 20 μm. B16F0 melanoma cells (B) and HaCaT cells (E) transfected with RFP-GFP-LC3 plasmid was treated with DMF02 (10 μM) for 8 h and 1 hr preincubation with chloroquine (CQ) and then subjected to confocal microscopy to evaluate autophagic flux. Yellow puncta represent autophagosomes and red puncta represent autolysosomes. Scale bar 10 μm. Western blotting (WB) of Nrf2, p62, ATG5-ATG12 complex, and LC3A/B-I, II. B16F0 melanoma cells (C) or HaCaT cells (F) were treated with DMF02 for the indicated time. Real-time PCR on the induction of p62. B16F0 melanoma cells (D) or HaCaT cells (G) were treated with DMF02 for indicated time. Data are mean ± SEM. * p < 0.05 vs. UVB plus vehicle alone. ** p < 0.05 vs. medium alone-added group. The difference was determined using the Student’s t-test.


