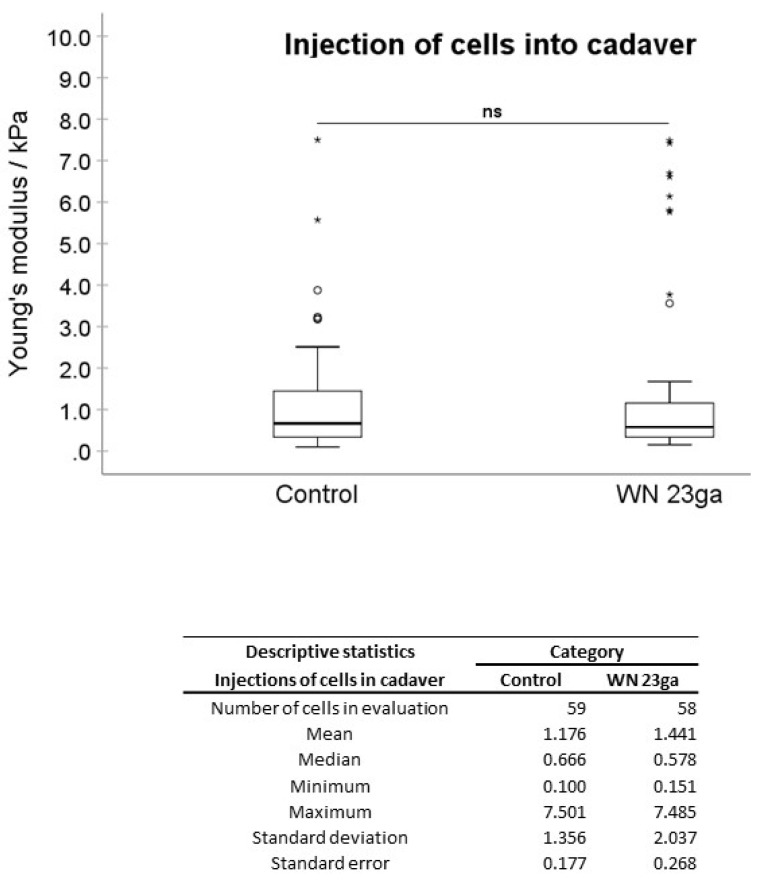
Figure 5.
Analysis of Young’s modulus of cell injections by WN in tissue. Boxplots (medians, minimum, maximum) of the stiffness (kPa) measured by atomic force microscopy for controls and WN-injected pADSCs in fresh porcine cadaveric tissue are depicted. The control (untreated) cell monolayers revealed no significant differences in stiffness when compared to the WN group. Descriptive statistics of Young’s moduli in the control and WN-injected cells in fresh porcine cadaveric tissue. Medians with minimum and maximum, means, standard deviations and standard errors of the mean of both groups are depicted. ns p > 0.05. Abbreviations: WN—Williams needle.

