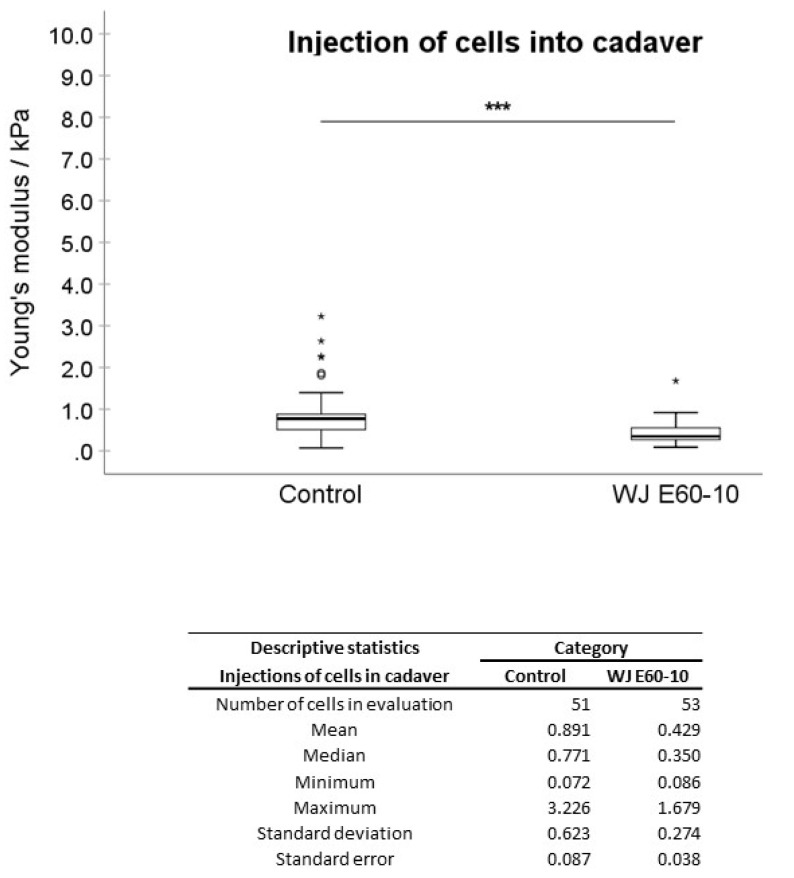
Figure 6.
Analysis of Young’s modulus of cell injections by WJ in tissue. Boxplots (medians, minimum, maximum) of the stiffness (kPa) measured by atomic force microscopy for controls and WJ-injected pADSCs in fresh porcine cadaveric tissue are depicted. The control (untreated) cell monolayers revealed a higher stiffness when compared to the WJ group. Descriptive statistics of Young’s moduli in control and WJ-injected cells in fresh porcine cadaveric tissue. Medians with minimum and maximum, means, standard deviations and standard errors of the mean of both groups are depicted. *** p < 0.001. Abbreviations: WJ—waterjet.

