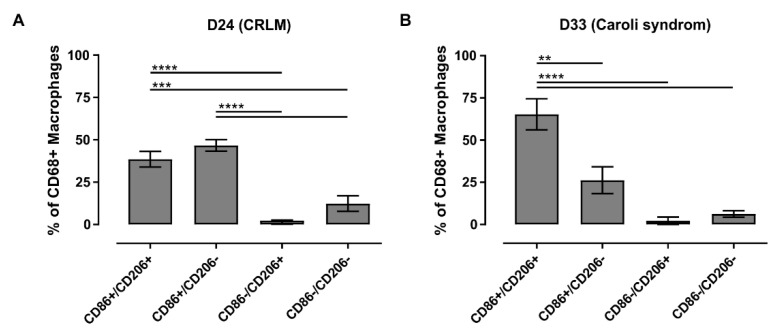
Figure 8.
Microscopic quantification of individual subpopulations of liver macrophages. Confocal laser scanning microscopy of adherent and fluorescence-stained human hepatic macrophages was used to analyze individual subpopulations. Staining was quantified for (A) patient D24 with CRLM and (B) patient D33 with Caroli syndrome and are shown as proportion of CD68+ cells. n = 5. Mean ± SD. **: p ≤ 0.01, ***: p ≤ 0.001, ****: p ≤ 0.0001 (CRLM: colorectal liver metastasis).

