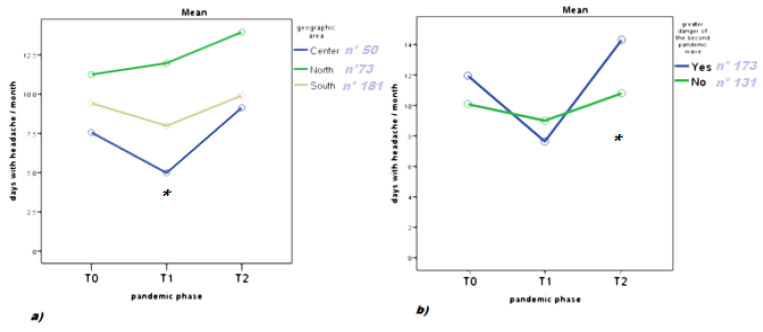
Figure 1.
Headache frequency before pandemic (T0), during first pandemic phase (T1), and during second pandemic phase (T2). Results of repeated measures ANOVA with: (a) geographic areas as factor. F: 2.50 p 0.03; degree of freedom 4; degree of error 602; * T0 vs. T1 p < 0.05; (b) subjective judgment of the second wave more dangerous than the first as factor F 3.16 p 0.044. Degree of freedom 2; degree of error: 301 sample size; Yes: 173; No: 131. * T0 vs. T2 p < 0.05.

