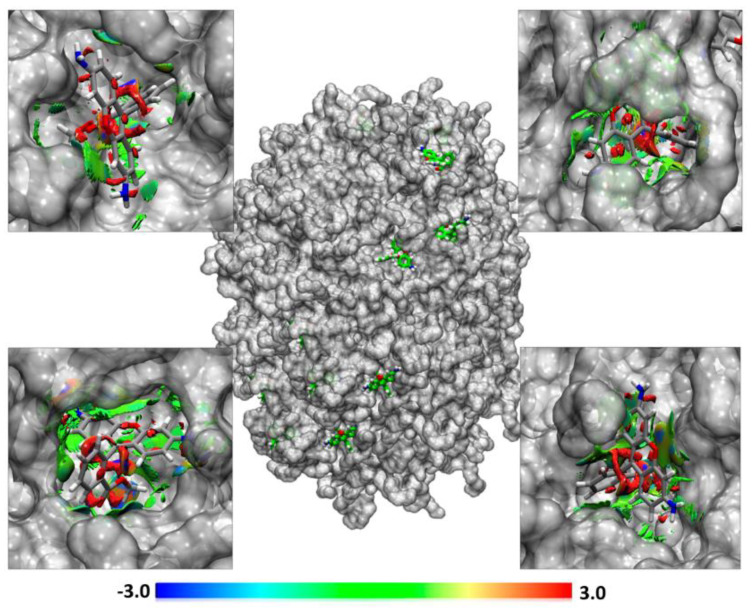
Figure 11.
NCIPLOT isosurface gradient (0.6 au) between Rhodamine 123 and mixed NLC of Miglyol® 812, Tween® 80 and Gelucire® 44/14. The surfaces were colored on a blue-green-red scale according to the strength and type of interaction. Blue indicates strong attractive interactions, green indicates weak Van der Waals interactions, and red indicates a strong non-bonded overlap.

