
Table 1.
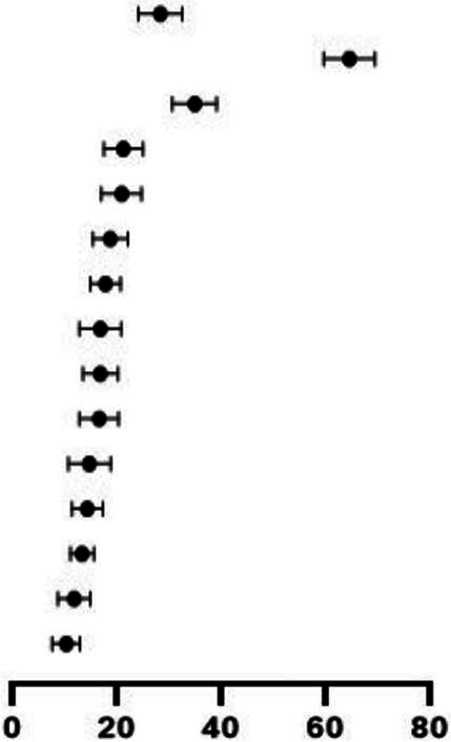
Clinical symptoms among reported paediatric COVID-19 cases
| Characteristics | Events/total patients | Mean proportion % (95% CI) | Heterogeneity I2 (%) | |
| Comorbidity | 1590/6086 |
|
27.1 (23.1 to 31.5) | 37.6 |
| Fever | 3576/6296 | 63.3 (58.6 to 68.4) | 34.9 | |
| Cough | 1807/5261 | 33.7 (29.6 to 38.1) | 34.4 | |
| Nausea/vomiting | 880/4243 | 20.0 (16.5 to 24.0) | 25.7 | |
| Diarrhoea | 796/4884 | 19.6 (16.1 to 23.7) | 13.4 | |
| Dyspnoea | 879/5332 | 17.5 (14.4 to 21.1) | 23.7 | |
| Nasal symptoms | 1080/5406 | 16.6 (13.9 to 19.7) | 10.6 | |
| Rashes | 744/4387 | 15.5 (11.9 to 19.9) | 25.9 | |
| Fatigue | 709/4474 | 15.5 (12.6 to 19.3) | 26.3 | |
| Abdominal pain | 626/4135 | 15.3 (11.9 to 19.4) | 26.5 | |
| Kawasaki shock/sign | 821/4365 | 13.3 (9.8 to 17.9) | 30.6 | |
| Asymptomatic | 1114/6084 | 13.1 (10.4 to 16.3) | 15.4 | |
| Neurological symptoms | 693/5475 | 12.1 (10.1 to 14.6) | 17.6 | |
| Conjunctivitis | 529/4998 | 10.5 (7.8 to 14.0) | 21.0 | |
| Pharyngeal erythema | 428/3638 | 9.0 (6.7 to 12.0) | 0.0 |