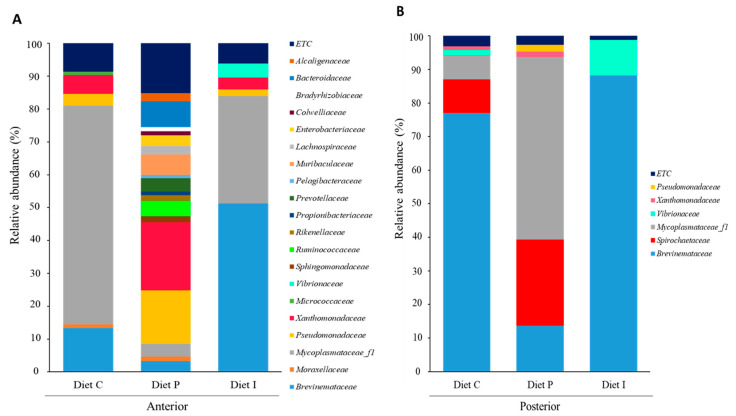
Figure 5.
Microbiota composition (relative OTUs composition) at family level of pooled intestinal contents from anterior (A) and posterior (B) intestinal sections of S. senegalensis specimens fed with control diet (diet C) and diets supplemented with live (diet P) or inactivated (diet I) Pdp11 cells. ETC indicates relative abundance percentage below 1%.

