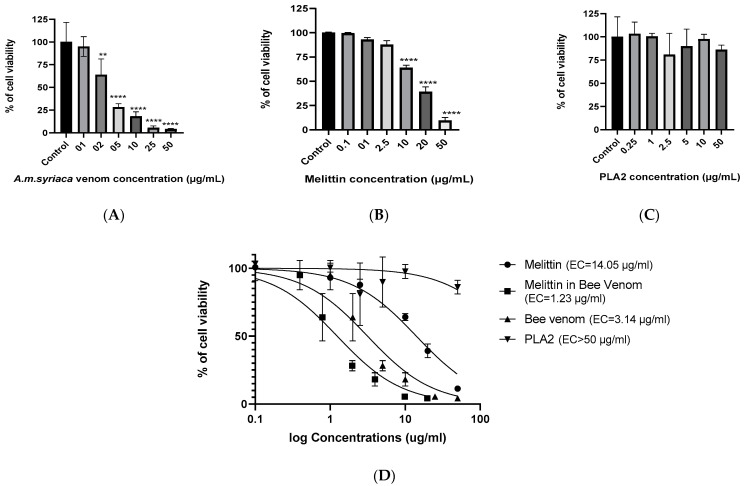
Figure 2.
Cell viability of HCT116 colon cancer cells was measured by MTT assay after treatment with increased concentrations of (A) A. mellifera syriaca venom, (B) standard melittin (MEL), and (C) standard PLA2. The results represent the mean ± SD of three independent experiments. Statistically significant compared with untreated cells ** p < 0.01, and **** p< 0.0001. (D) Curves for MTT assay showing EC50 values and the % of cell viability in function of log concentrations of standard MEL, MEL in A. mellifera venom (titration curve), A. mellifera venom (from A. mellifera syriaca bees), and standard PLA2. The results represent the mean ±SD of three independent experiments.

