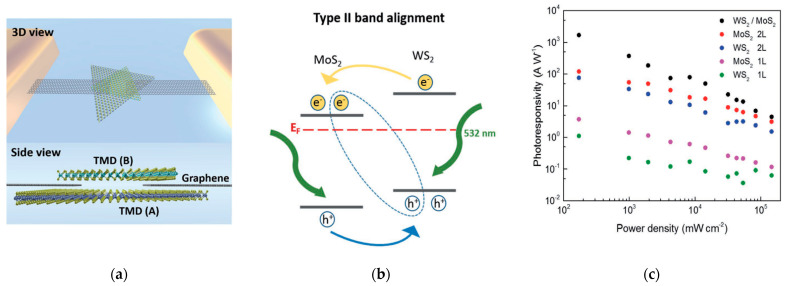
Figure 18.
(a) Representation of a MoS2Graphene–WS2 heterostructure; (b) Band alignment at the heterojunction between MoS2 and WS2; (c) photoresponsivity values for different light power input of the WS2-Gr-MoS2 heterostructure (black dots), compared to the responsivity of the single TMDs. Reprinted with permission from ref. [57]. © 2017, John Wiley and Sons.

