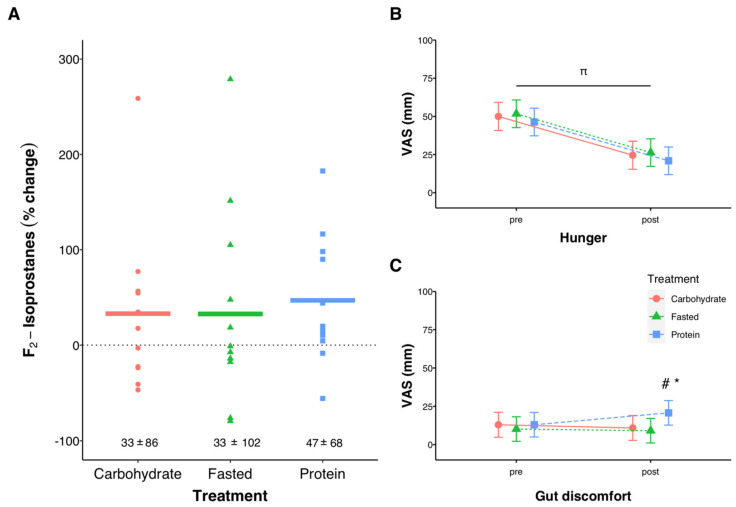
Figure 5.
Urinary F2-Isprostane percent change (pre to post-exercise, (A)), and subjective levels of hunger (B) and gut discomfort (C) before and after exercise using a visual analog scale (VAS). All measurements at ‘pre’ were taken upon arrival to the lab in the overnight-fasted state, before being provided any nutrition treatment. In (A) individual data points are shown with solid lines representing means and the numeric values reflecting mean ± SD. In (B,C) error bars represent 95% confidence intervals of the model-estimated mean. π significant effect of time (p < 0.001), significant effects of treatment (# PROTEIN vs. CARB, p = 0.012, * PROTEIN vs. FASTED, p = 0.032) at the post time point. For (A), n = 12 for Carbohydrate, n = 12 for Fasted, and n = 11 for Protein.

