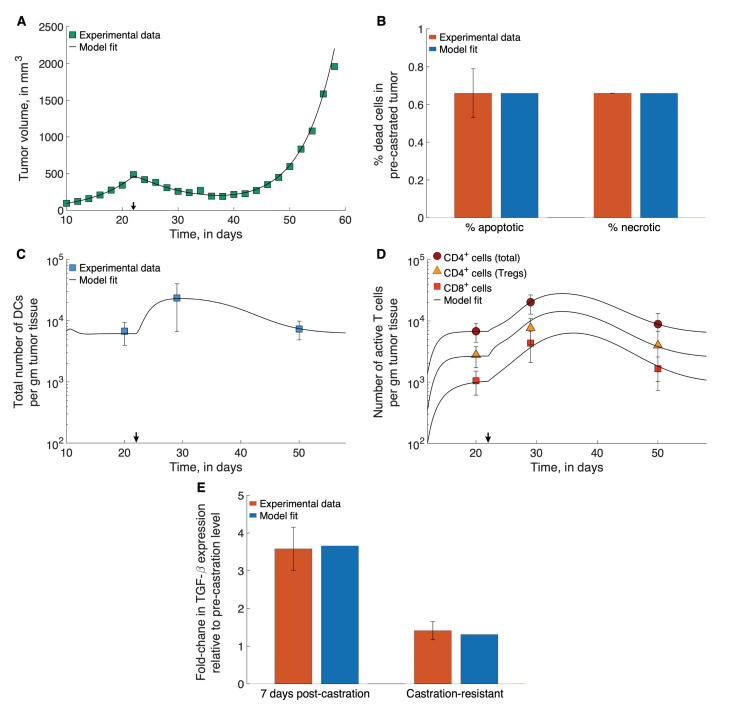
Figure 2.
Model fits to data. (A) Model fitted to time-course treatment data on PCa xenograft volume, showing spontaneous emergence of castration resistance (black arrow indicates onset of ADT). (B) Model fitted to data on degree of apoptosis and necrosis in PCa xenografts, in the absence of treatment. (C,D) Model fitted to time-course treatment data on PCa xenograft immune cell infiltration (black arrow indicates onset of ADT). (E) Model fitted to fold-changes in TGF- expression within the xenografts 7-days post-ADT administration, and after the emergence of castration-resistance. Data were taken from [16,60,61].

