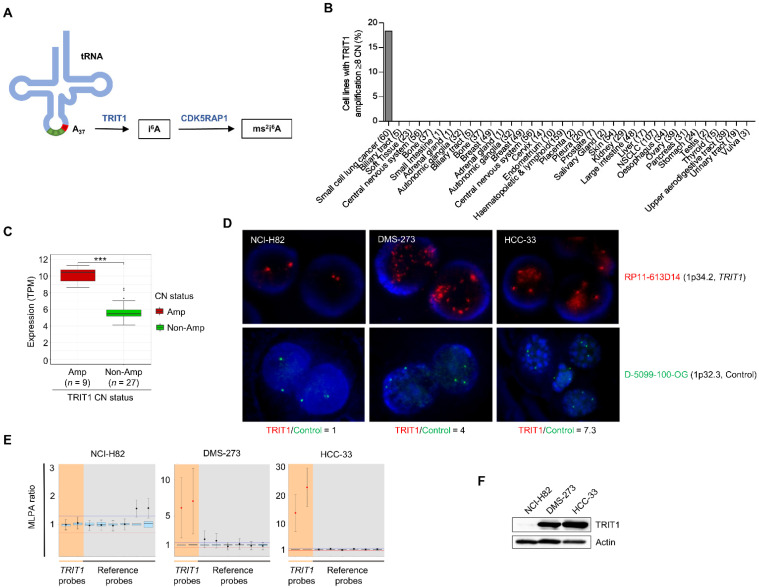
Figure 1.
Determination of TRIT1 gene amplification and RNA and protein overexpression in small-cell lung cancer cell lines. (A) Schematic representation of adenosine derivatives synthesis at position A37 of human tRNA. The enzymes catalyzing these reactions are shown in blue. Abbreviations are: A, adenosine; i6A, N6-isopentenyladenosine; ms2i6A, 2-methylthio-N6-isopentenyladenosine. (B) Frequency of TRIT1 gene amplification in the panel of cancer cell lines. (C) TRIT1 gene amplification was significantly associated with high levels of the TRIT1 transcript in the small-cell lung cancer cell lines for which expression patterns were available (n = 36). Non-Amp, non-amplified; Amp, amplified. TPM, transcripts per million. p-value obtained by Wilcoxon rank sum test. *** p < 0.001. (D) Fluorescence in situ hybridization for the TRIT1 gene. The UCSC genome browser was used to select the bacterial artificial chromosome (BAC) clone spanning the 1p34.2 region for the TRIT1 gene: RP11-613D14. The BAC was obtained from the BACPAC Resource Center at the Children’s Hospital Oakland Research Institute (Oakland, CA, USA). TRIT1 probe was labeled with Red dUTP (Abbott, Wiesbaden, Germany), using a CGH Nick Translation Reagent Kit (Abbott Molecular Inc., Des Plaines, IL, USA). The samples were counterstained with DAPI and analyzed under a fluorescent microscope (NIKON, Eclipse E400). Gene amplification was found in the interphases of DMS-273 and HCC-33. The D-5099-100-OG probe (1p32.3, MetaSystems) was used as control. TRIT1/Control ratios are shown. (E) Multiplex ligation-dependent probe amplification (MLPA) assay. Probe mixes contained two probes for exons 4 and 9 of the TRIT1 gene (in orange). Six reference probes were also included (in grey). Values greater than 2 (two copies, corresponding to MLPA ratio of 1) were considered to indicate the presence of extra copies. DMS-273 and HCC-33 cell lines showed TRIT1 gene amplification, whilst NCI-H82 is shown as an example of TRIT1 two copy number cells. (F) TRIT1 expression levels in gene-unamplified (NCI-H82) and amplified (DMS-273 and HCC-33) cancer cell lines determined by Western blot analysis. Actin is shown as the loading control. The uncropped Western blots have been shown in Figure S3.

