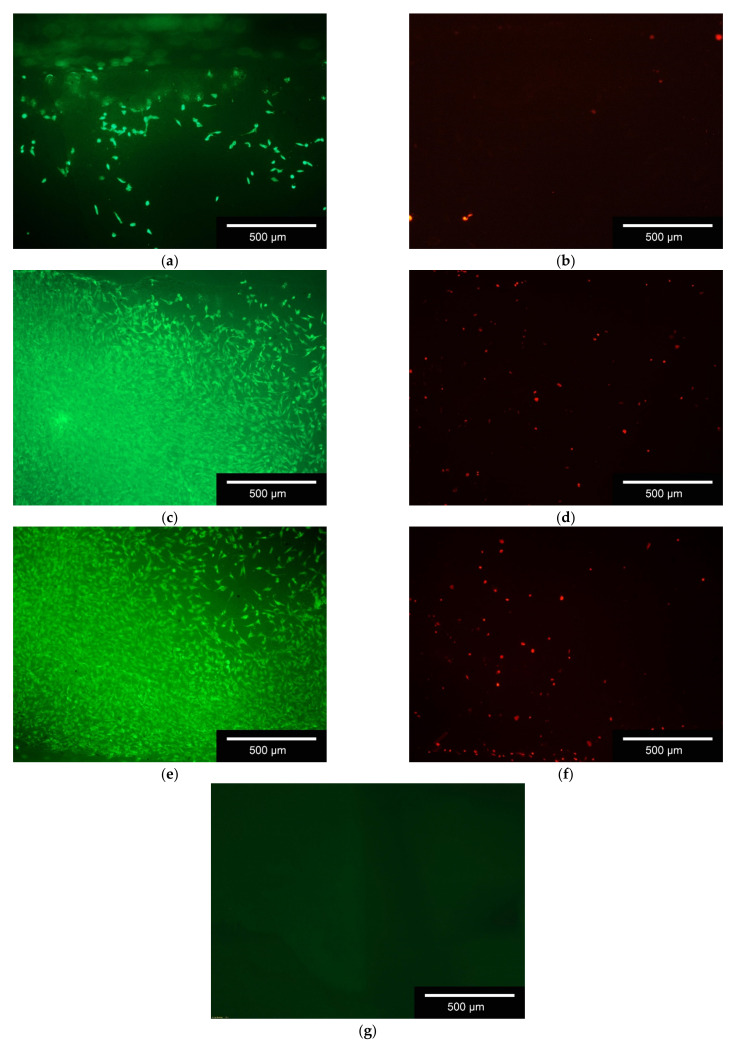
Figure 8.
Live/Dead Staining; exemplary images of 1000(2500); (a) living cells on the scaffold after 3 days; (b) dead cells on the scaffold after 3 days; (c) living cells on the scaffold after 7 days; (d) dead cells on the scaffold after 7 days; (e) living cells on the scaffold after 10 days; (f) dead cells on the scaffold after 10 days; (g) auto-fluorescence of the ceramics, exposure time 10× as high as the other; living cells = green; dead cells = red; white bar = 500 µm, images taken with Olympus BX-53 Fluorescence microscope.

