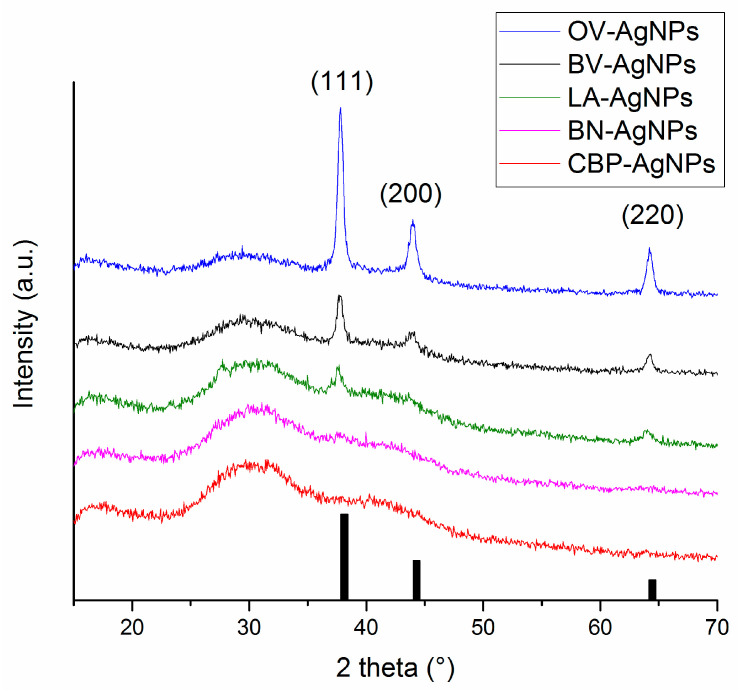
Figure 4.
The X-ray diffraction (XRD) patterns of the dried solids after centrifugation after the green synthesis of AgNPs starting from 5 mM AgNO3 and using 5 different plants. Bar graphs represent the Bragg‘s reflections of cubic base-centred (fcc) elemental silver (ICDD-PDF2-065-2871). The Miller indices of the crystallographic planes corresponding to the three most intensive reflections of fcc-Ag are indexed in parentheses.

