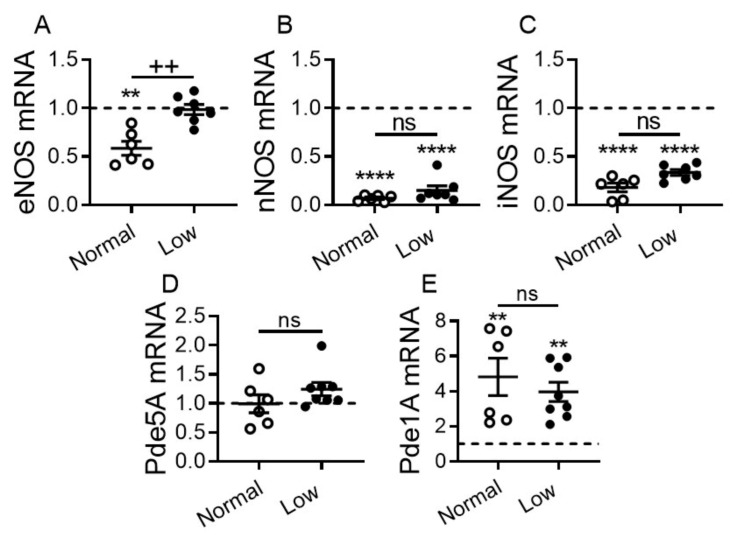
Figure 8.
Effect of dietary sodium restriction on cardiac expression of nitric oxide synthases (NOS) and phosphodiesterases (Pde) in mice with DCM. Cardiac transcript levels of (A) eNOS, (B) nNOS, (C) iNOS, (D) Pde5A, and (E) Pde1A. Number of DCM mice n = 6–8 per group. WT control mice (dashed line, n = 5–6). Data are presented as mean ± SEM. **** p < 0.0001, ** p < 0.01 (DCM vs. WT), ++ p < 0.01 (LSD vs. NSD), ns = non-significant. Data were analyzed by one-way ANOVA with Newman–Keuls multiple comparison test.

