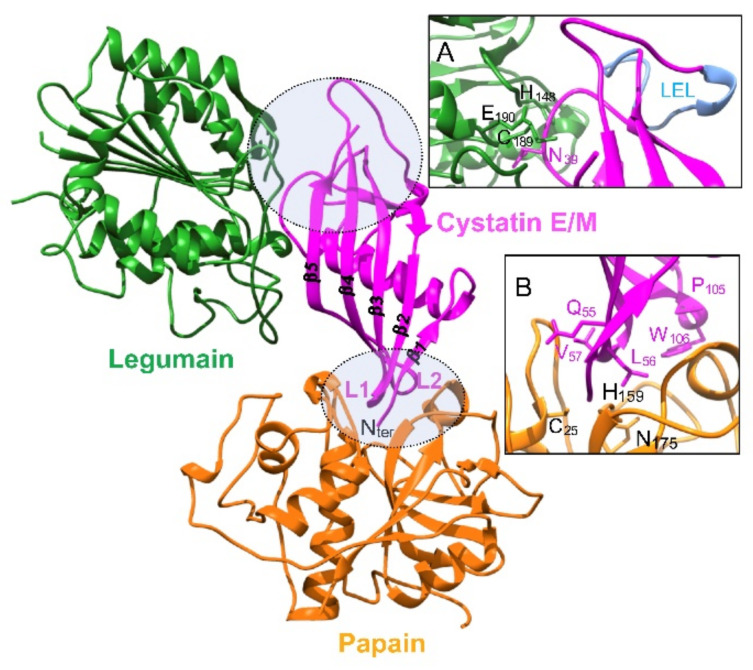
Figure 1.
Structural schema representing cystatin M/E complexed with papain and human legumain. A model of cystatin M/E complexed with papain was performed using the protein structure homology-modelling Swiss-Model server (https://swissmodel.expasy.org/interactive) (accessed date: 31 January 2021). The structure of tarocystatin-papain (PDB: 3IMA.1) was used as a template (79.19% sequence identity of tarocystatin with cystatin M/E). The modeled cystatin M/E structure was then superimposed with the crystal structure of legumain in complex with cystatin M/E (PDB: 4N6N) [36]. Inhibitory sites of cystatin M/E are indicated by a circle. Inset A: zoom-in view of the legumain-interacting inhibitory loops: reactive center loop (RCL, including residue N39) and exosite loop (LEL). Inset B: zoom-in view of the inhibitory segments L1 (Q55LVAG59) and L2 (P105W106) of cystatin M/E with the active site of papain (catalytic triad: C25, H159, and D175). Key residues are shown in stick representation. Cystatin C numbering is used for cystatin M/E.

