Figure 2.
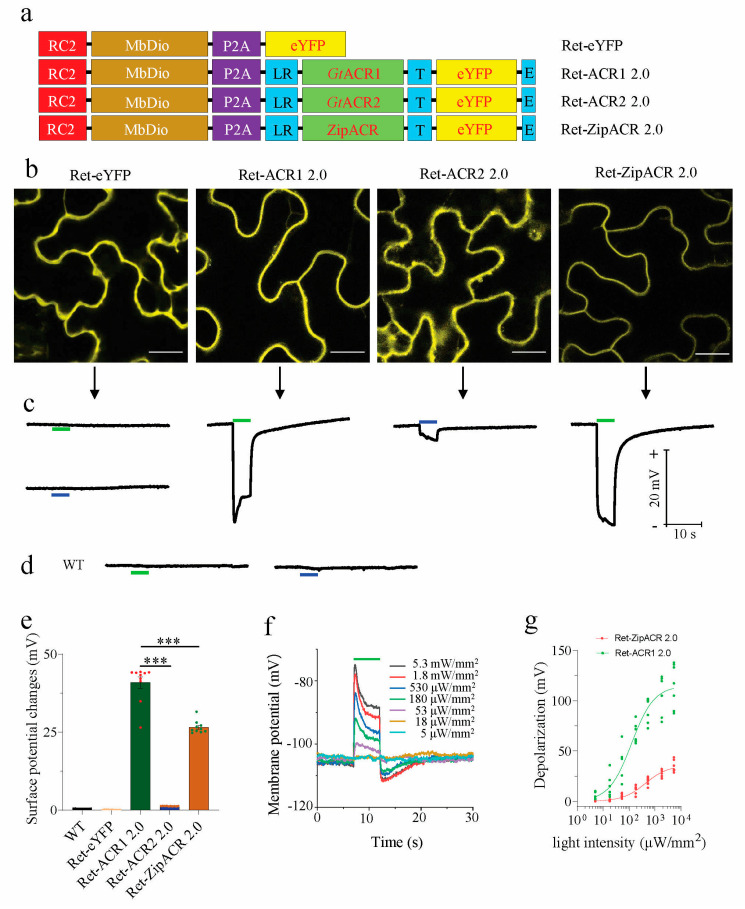
Functional expression of ACR2 and ZipACR in N. benthamiana leaves. (a) Schemes of the Ret-eYFP, Ret-ACR1 2.0, Ret-ACR2 2.0 and Ret-ZipACR 2.0 DNA constructs. (b) Representative confocal images of N benthamiana epidermal cells expressing Ret-eYFP (n =15), Ret-ACR1 2.0 (n = 15), Ret-ACR2 2.0 (n = 11) and Ret-ZipACR 2.0 (n = 3), the images were taken 3 days post infiltration (dpi), scale bar = 200 μm. (c) Surface potential recordings on N. benthamiana leaves expressing Ret-eYFP, Ret-ACR1 2.0, Ret-ACR2 2.0 and Ret-ZipACR 2.0 upon 532 nm green light (green bar) or 473 nm blue light (blue bar) with 180 μW/mm2 for 5 s, n = 10 for each construct, and the recording was performed 3 dpi. (d) The surface potential recordings on the leaves of wild-type N. benthamiana (WT) with 180 μW/mm2 532 nm green light (green bar) and 473 nm blue light (blue bar) for 5 s, n = 10. (e) The comparison of light-induced surface potential changes on N. benthamiana leaves expressing Ret-eYFP, Ret-ACR1 2.0, Ret-ACR2 2.0, and Ret-ZipACR 2.0 illuminated with the same wavelength as in (d), WT and Ret-eYFP-expressing plants were exposed to green light (532 nm). The statistical significance is performed by One-way ANOVA following the Turkey test. Ret-ACR 1 2.0 vs. Ret-ACR 2 2.0, p = 6.8 × 10⁻¹³, Ret-ACR1 2.0 vs. Ret-ZipACR 2.0, p = 7.2 × 10⁻¹³. (f) A representative membrane potential recording in mesophyll cells of N. benthamiana leaves expressing Ret-ZipACR 2.0 under 5 s green light (532 nm, green bar) of different intensities. (g) The comparison of the light sensitivity of Ret-ACR1 2.0 and Ret-ZipACR 2.0, for Ret-ACR1, EPD50 = ~125 μW/mm2, and for Ret-ZipACR 2.0, EPD50 = ~420 μW/mm2). ***, p ≤ 0.001.

