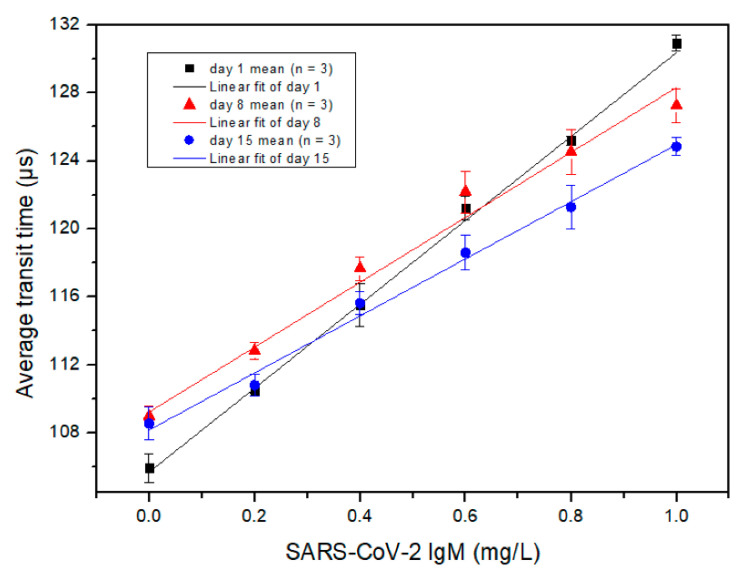
Figure 5.
The measured relationship between the average transit time and the concentration of SARS-CoV-2 IgM detected at different days of secondary antibody conjugated MB storage. Each symbol is the mean value of three detections from duplicated samples. Error bars are the standard deviation of the three detections.

