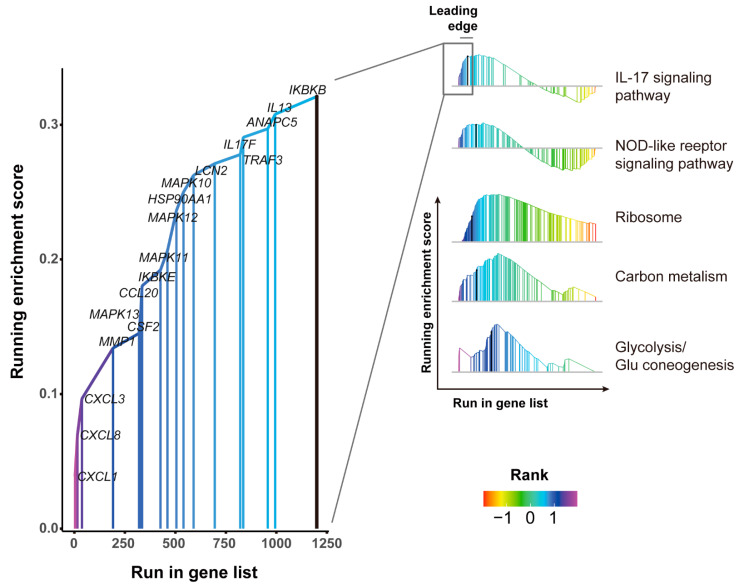
Figure 4.
Rank-based gene set enrichment analysis of genes that were regulated upon SADS-CoV infection. The X-axis always indicates the rank of the change value. The change values are sorted in descending order from the left to right; namely, the maximum change value is sorted as 1. The colored fold line indicates the change curve of the gene enrichment score (ES), and the Y-axis is the ES value. The leading edge genes subset indicates a strong relation to the pathway.

