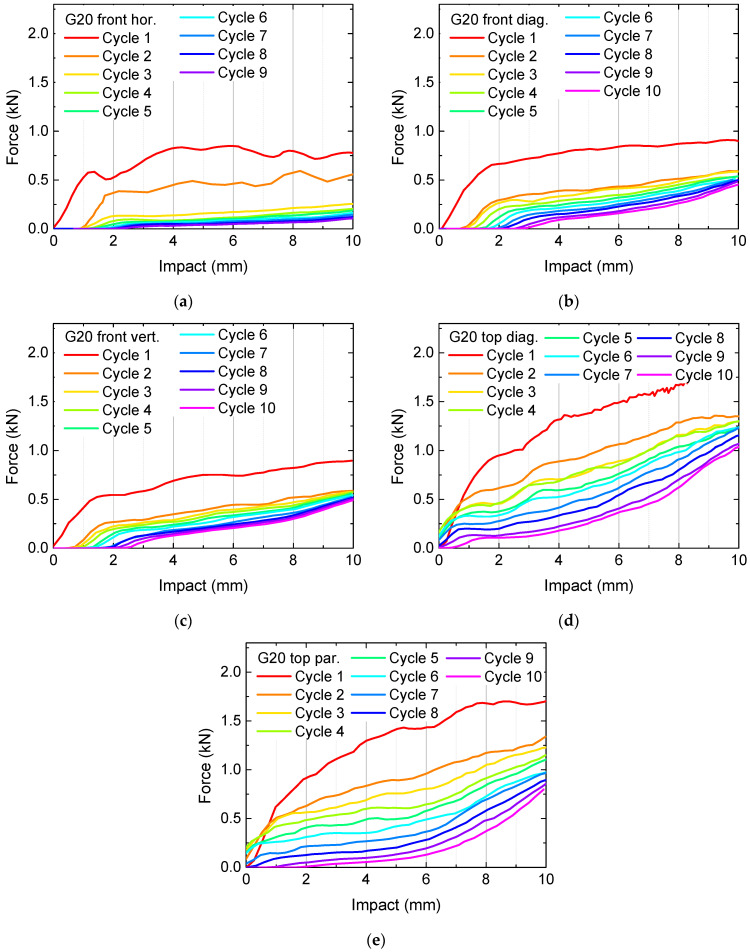
Figure 3.
Quasi-static load tests in original state and after several test and recovery processes of samples G20: (a) front horizontal; (b) front diagonal; (c) front vertical; (d) top diagonal; (e) top parallel to the edges. The y-axes are scaled differently from Figure 2.

