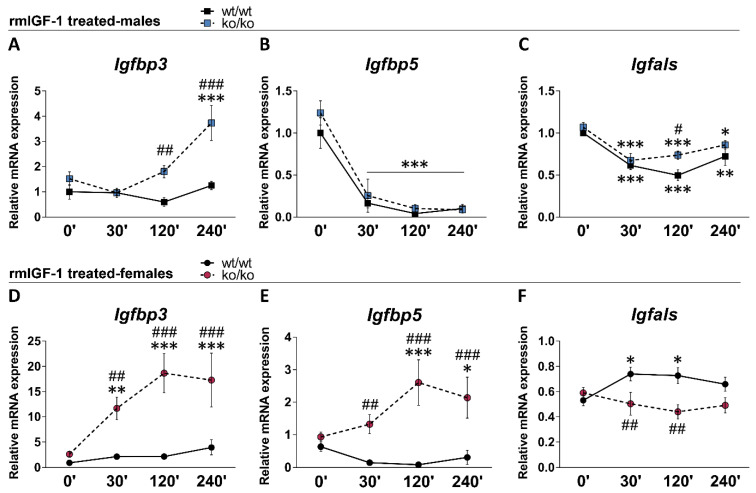
Figure 2.
Relative mRNA levels of Igfbp3, Igfbp5 and Igfals in the tibia of Pappa2wt/wt and Pappa2ko/ko mice at 0′, 30′, 120′ and 240′ after rmIGF-1 administration in males (A–C) and females (D–F). Data are represented as mean ± S.E.M (n = 6–9/group). Tukey-corrected tests: #/##/### p < 0.05/0.01/0.001 between genotypes (same time); */**/*** p < 0.05/0.01/0.001 versus 0′ (same genotype).

