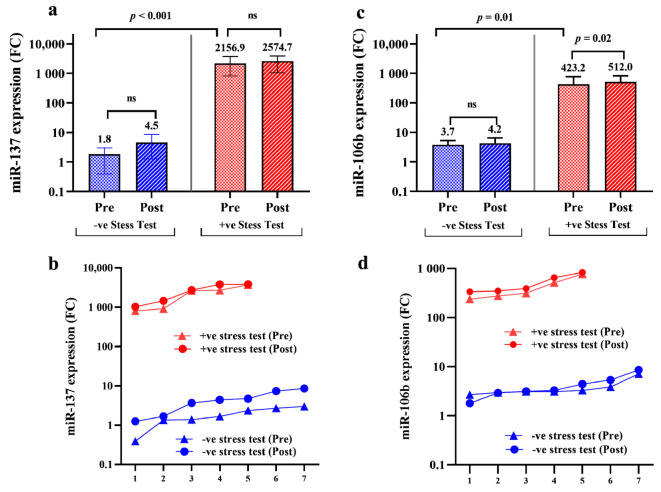
Figure 3.
Bar chart graph illustrates miR-137 (a) and miR-106b-5p (b) expression levels in patients with chest pain and suspected of CAD; miRNA expression levels were measured before stress test-induced ischemia, “pre-stress test” and 30 min “post-stress test”; the “expression patterns” of Nourin miRNAs, miR-137 (c) and miR-106b-5p (d) were plotted for positive stress test patients “pre-stress test” and 30 min “post-stress test” and compared to patients who showed negative results in order to investigate the computability of Nourin miRNAs level and stress test results; p < 0.05 considered significant; ns: no-significant difference.

