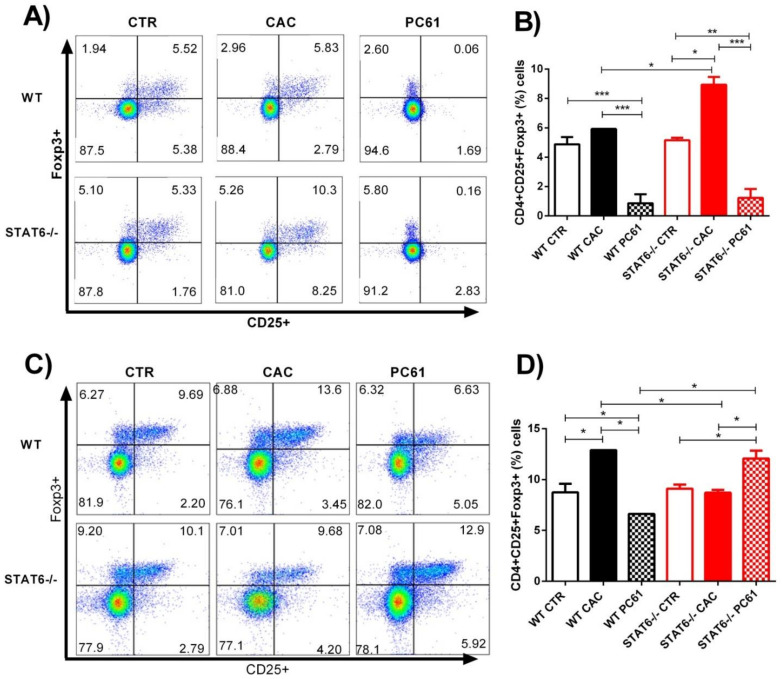
Figure 4.
Treatment with anti-CD25 antibody (PC61) during early CAC. The treatment of the mice is shown in Figure 3A. At Day 25 and Day 77, different populations of circulating cells were analyzed by flow cytometry. (A) Representative dot plots (A,C) and frequencies (B,D) of the CD4+CD25+Foxp3+ cells from the WT CAC or STAT6−/− CAC and PC61-treated WT or STAT6−/− mice at Day 25 (A,B) or Day 77 (C,D) after the AOM/DSS administration. The data are expressed as the mean ± SEM and are representative of two independent experiments, with at least three mice per group per day of the analysis. * p < 0.05, ** p < 0.01, *** p < 0.001.

