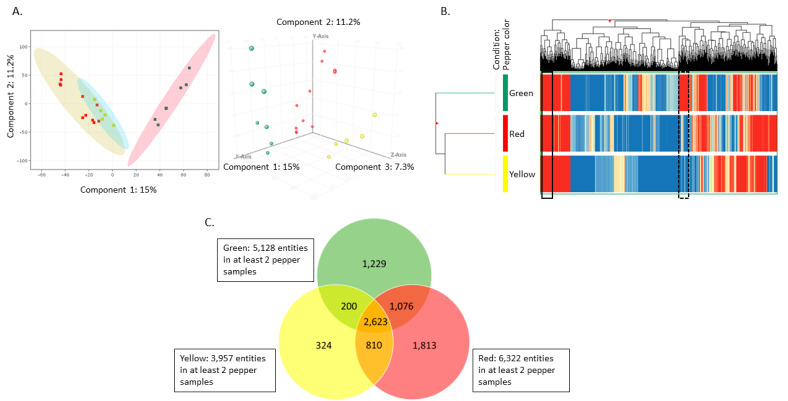
Figure 1.
Pepper color is the main driver of differences between pepper conditions. (A) Principal component analysis (PCA) was performed in Agilent Technologies Mass Profiler Professional Version 14.1 (MPP) using data from all bell pepper samples. Component 1, which explains 15% of the variation, is shown on the x-axis; component 2, which explains 11.2% of the variation, is shown on the y-axis; and component 3, which explains 7.3% of the variation, is shown on the z-axis. (B) Hierarchical clustering of data from 23 replicates from six individual bell peppers. The x-axis corresponds to individual compounds detected in the peppers, which are grouped by color and listed on the y-axis. Blue lines indicate less relative abundance of a compound compared to the other 8174 compounds, while red lines indicate higher relative abundance compared to the other 8174 compounds. The vertical distance between compounds provides a rough estimation of their similarity. (C) Venn diagram illustrates overlap between the 2623 compounds detected in all colors of pepper samples (center section), the 1229 compounds detected in green peppers (green circle), but not red or yellow; the 200 compounds in both green and yellow; and the 1076 compounds in both green and red pepper. Within the yellow peppers (yellow circle), 324 compounds were detected in yellow but not red or green and 810 compounds were detected in both yellow and red bell peppers. Red peppers contained 1813 compounds that were detected in red (red circle), but not green or yellow bell peppers.

