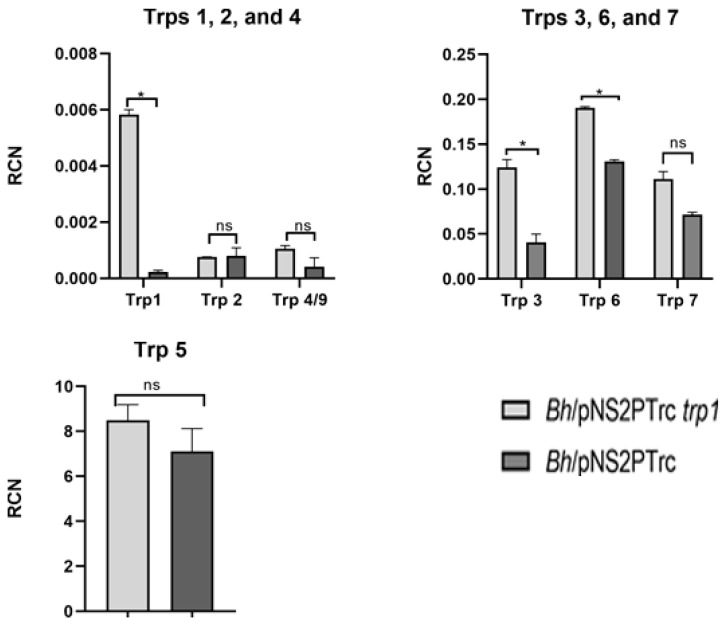
Figure 2.
RT-qPCR showing expression of trps in B. henselae Houston-1/pNS2PTrc trp1 (overexpressing trp1) with B. henselae Houston-1 pNS2PTrc as control. Upper left: Expression of trps 1, 2, and 4/9. Upper right: Expression of trps 3, 6, and 7. Lower: Expression of trp 5. Relative copy number (RCN) was compared to reference rplD mRNA. Bars represent means of three independent experiments, and error bars represent standard errors. Statistical analysis using Student’s t-test was performed using GraphPad Prism (GraphPad Software, San Diego, CA, USA), (*) with a p-value < 0.05 considered statistically significant as indicated.

