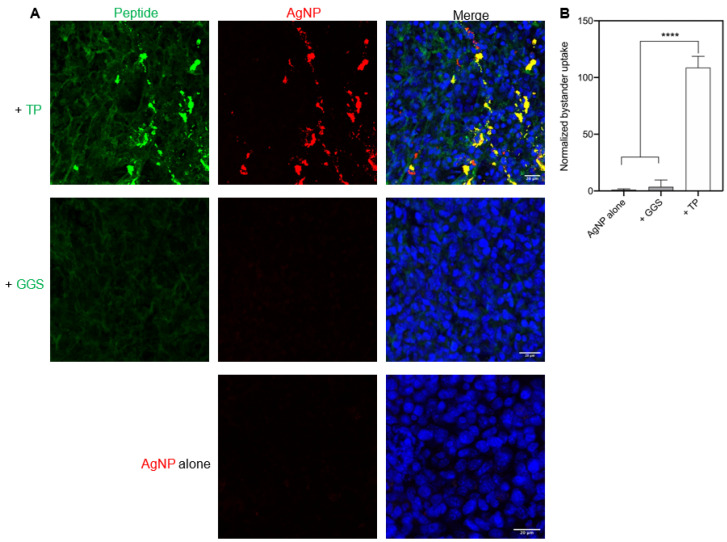
Figure 5.
TP-induced bystander uptake under physiological conditions. (A) Confocal microscopy images of bystander AgNP uptake by live tumor slices. AgNPs (AgNP-555, red) were incubated with live 4T1 tumor slices either alone, or with TP or GGS peptide, as described in the Methods. After 2-h incubation, slices were etched, stained with DAPI (blue), and then subjected to imaging. GGS was a control peptide. Representative images were shown here. Scale bars, 20 μm. (B) Quantification of AgNP uptake by live tumor slices. Mean fluorescence intensity of bystander cargo (AgNP-555) obtained from three independent experiments (n = 3) through Image J software was normalized to that of AgNP alone group (y-axis). Values shown here were mean ± s.d. There was a statistically significant difference between TP group and other groups as determined by one-way ANOVA with Tukey’s multiple comparisons test. **** p < 0.0001.

