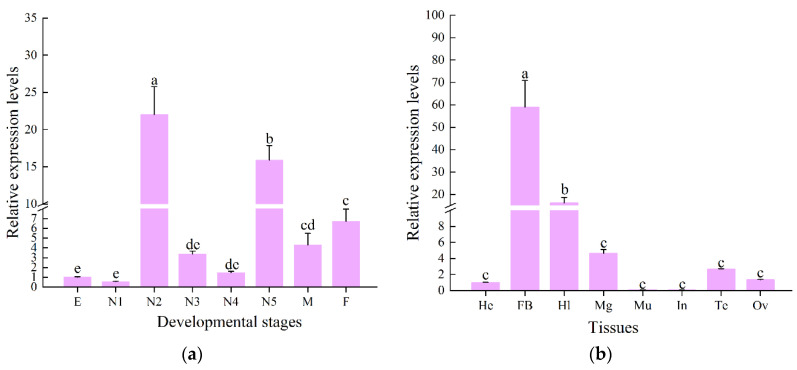
Figure 5.
Spatiotemporal expression profile of CcLys2. (a) Expression levels of CcLys2 at various developmental stages. E: egg; N1–N5: first–fifth-instar nymphs; F: female; M: male. (b) Expression levels of CcLys2 in different adult tissues. He: head; FB: fat body; Hl: hemolymph; Mg: midgut; Mu: muscle; In: integument; Te: testis; Ov: ovary. Data are expressed as the mean ± SD. Different letters above the bars represent significant differences at p < 0.05 based on Duncan’s test.

