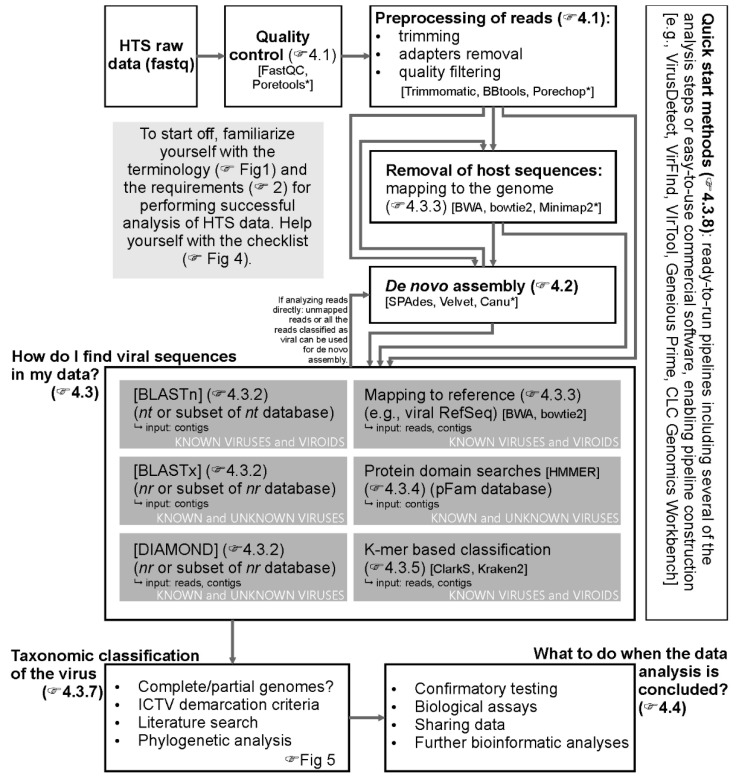
Figure 2.
Flowchart representing different approaches for the analysis of HTS data for the detection of plant viruses. Boxes represent different steps in data analysis and interpretation. Arrows connect different possible sequences of the analysis steps. As an example, a non-exhaustive list of possible analysis tools is added in the square brackets at each of the analysis steps. Tools designated with * are intended for use with long-read or, specifically, nanopore sequencing data. Pointing hands lead to the text sections (or figures) with more detailed description of the corresponding steps.

