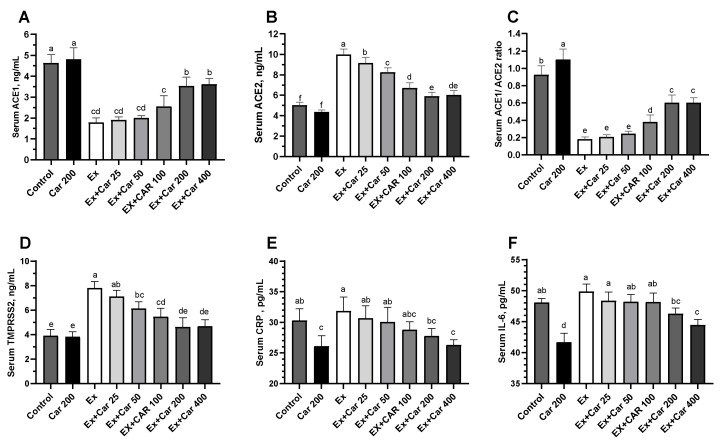
Figure 2.
Serum protein levels of ACE1 (A), ACE2 (B), ACE1/ACE2 ratio (C), TMPRSS2 (D), C-reactive protein (CRP) (E), and interleukin 6 (IL-6) (F) in rodents. Statistical comparisons are indicated with different superscripts (a–f); in the plots (p < 0.05, ANOVA, and Tukey’s post-hoc test). Different letters indicate statistical differences. Shown are mean ± SD of three independent analyses. Control groups: Car: L-carnitine; Ex: Exercise.

