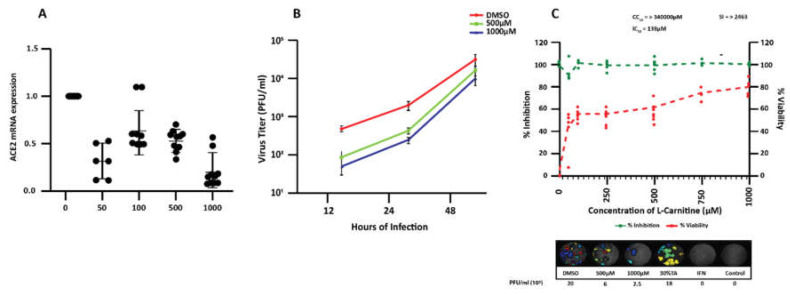
Figure 4.
Dose-dependent effect of L-carnitine on ACE2 mRNA and Calu-3 infection by severe acute respiratory syndrome coronavirus 2 (SARS-CoV-2) (A) mRNA expression levels of ACE2 in Calu-3 as determined by RT qPCR. Calu-3 cells were left untreated or treated for 24 h with indicated concentrations of L-carnitine. Shown are the mean ± SD of three independent analyses, done in duplicates. Statistical analysis: Mann–Whitney’s test. (B) Replication kinetics were studied at 12 h, 24 h, and 48 h post infection by plaque assay to determine infectious virus release from infected cells treated or not with L-carnitine. A line graph represents results of the quadruplicate plaque assay done with two biological replicates (mean ± SD). (C) Percentage of inhibition of SARS-CoV-2 titer (at 24 h post infection) in infected cells treated with indicated concentrations of L-carnitine was determined by plaque assay done in quadruplicate (each point represents a replicate) (top panel). The left y-axis indicates the inhibition of virus titer (percent) relative to that of the untreated DMSO-treated group [21]. The right y-axis indicates the cell viability (percent) relative to that of DMSO-treated group (green). The CC50 (50% cytotoxic concentration), IC50 (half maximal inhibitory concentration), and SI (selectivity index, determined by CC50/IC50) values for L-carnitine are as shown. Representative plaque images of infected Calu-3 cells treated with indicated varying L-carnitine concentration are shown in the bottom panel. Tartaric acid (TA) 30% and IFN-2a were used as internal controls. *, **, *** statistically significant. ns: not significant.

