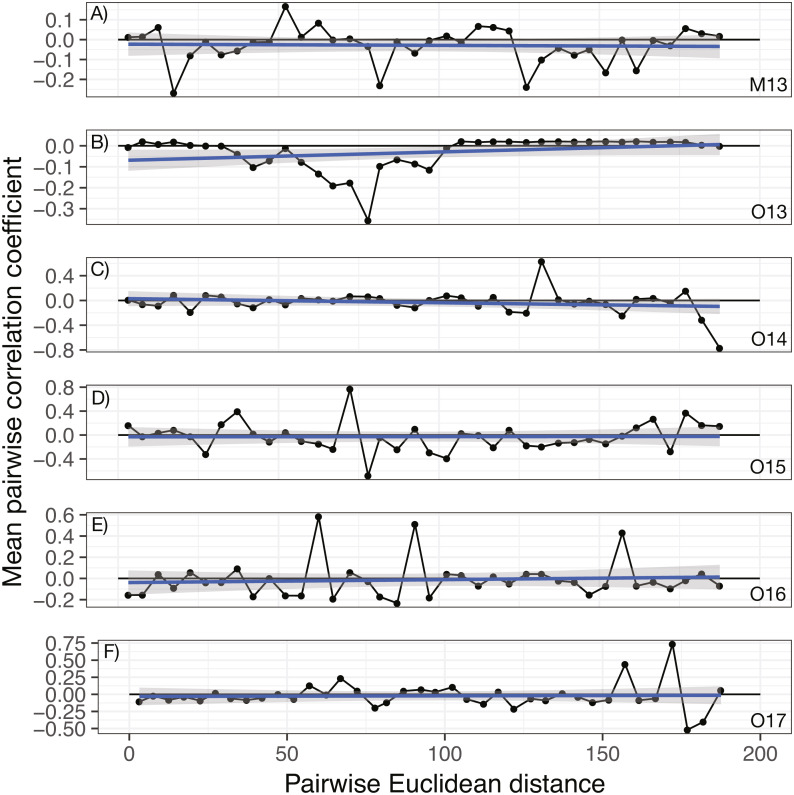
Figure 1. Annual correlograms of target isolate abundance by vine distance.
Correlograms for samples taken in (A) May 2013, (B) October 2013, (C) October 2014, (D) October 2015, (E) October 2016, and (F) October 2017. No spatial autocorrelation was detected in any time frame (see Table S1 for statistics), which would appear as consistent, positive correlation at shorter distances. Each point represents the mean correlation coefficient for all pairwise vine combinations within the range of distance represented by that point. The black line represents the zero correlation line, the blue line shows the regression line, and the shading depicts the 95% confidence interval on the regression line.

