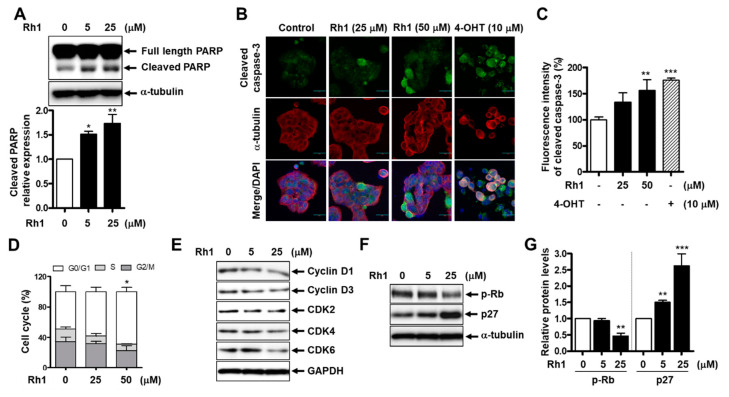
Figure 2.
Rh1 induced cell apoptosis and cell cycle arrest in MCF-7 cells. (A) The cells were treated with Rh1 (0, 5, and 25 µM) for 24 h. Whole-cell lysates were then used to analyze the protein expression as indicated. α-tubulin was used as a loading control. (B,C) The cells were treated with Rh1 (0, 25, and 50 µM) or 4-OHT (10 µM) for 24 h. An immunofluorescence analysis was performed after fixing and immunostaining. Images are shown at ×200 magnification (B). Scale bar indicates 30 μm. Quantified graph showed the relative fluorescent intensity of cleaved caspase-3 using Image J software (C). (D) MCF-7 cells were treated with Rh1 at different concentrations for 24h. After the treatment, the cells were harvested for the cell cycle distribution analysis using flow cytometry. (E) The cells were treated with Rh1 (0, 5, and 25 µM) for 24 h. Total cell lysates were analyzed by Western blotting using the indicated antibodies. (F,G) The cells were treated with Rh1 (0, 5, and 25 µM) for 24 h. Total cell lysates were analyzed by Western blotting using the indicated antibodies (F). The relative quantification of the protein levels was analyzed by Image J software (G). (A,C,D,G) Data are expressed as the mean ± SD (n = 5), * p < 0.05, ** p < 0.01, and *** p < 0.001 as compared with the control. 4-OHT: 4-hydroxytamoxifen, CDK: cyclin-dependent kinase, and GAPDH: glyceraldehyde 3-phosphate dehydrogenase.

