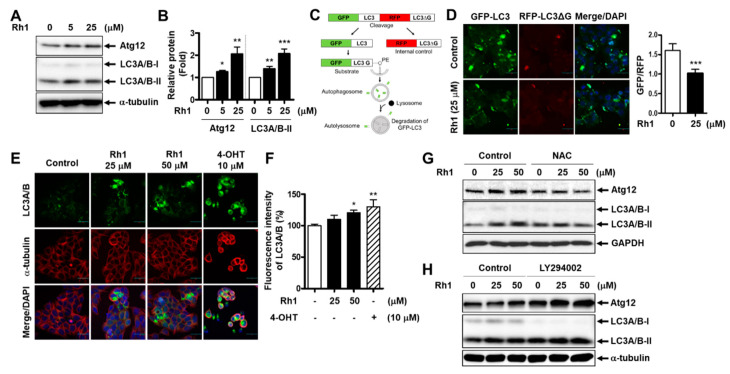
Figure 5.
Rh1 induces autophagy in MCF-7 cells. (A,B) The cells were treated with Rh1 for 24 h. Total cell lysates were then analyzed using Western blotting (A). The relative quantification of protein levels was analyzed using Image J software (B). (C) The scheme presents the principle of the dual GFP/RFP-LC3 autophagy flux sensor system. (D) MCF-7 cells were transduced with pMRX-IP-GFP-LC3-RFP-LC3ΔG retroviral vectors for 30 h and then treated with Rh1 (25 µM) for 14 h. The cells were then observed under a laser scanning confocal spectral microscope. Images are shown at ×200 magnification. Scale bar indicates 30 μm. The relative GFP/RFP ratio is represented as the mean ± SD (n = 5). *** p < 0.001 as compared with the control. (E,F) The cells were treated with Rh1 (25 and 50 µM) or 4-OHT (10 µM) for 24 h. An immunofluorescence analysis was performed after fixing and immunostaining. Images (E) are shown at ×200 magnification. Scale bar indicates 30 μm. The relative fluorescence intensity of LC3A/B (F) are represented as the mean ± SD (n = 5), * p < 0.05 and ** p < 0.01 as compared with the control. (G,H) The cells were pretreated with 20-mM NAC (G) or 5-µM LY294002 (H) for 3 h, followed by the treatment with Rh1 for 24 h. Total cell lysates were subjected to Western blotting. 4-OHT: 4-hydroxytamoxifen, NAC: N-acetylcysteine, LY294002: PI3K inhibitor, GFP: green fluorescent protein, and RFP: red fluorescent protein.

