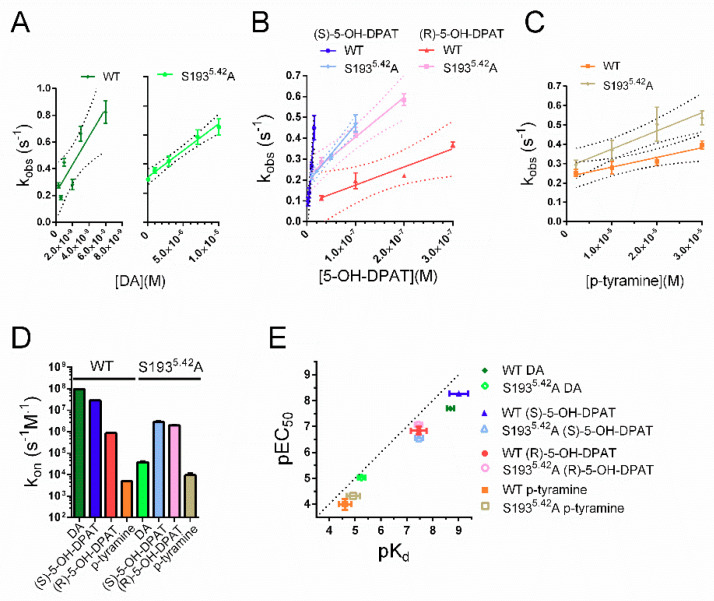
Figure 3.
Estimation of agonist kon at WT and S1935.42A mutant D2R. Individual concentrations of (A) DA, (B) (S)-5-OH-DPAT and (R)-5-OH-DPAT, and (C) p-tyramine were added to oocytes co-expressing WT D2R or D2R S1935.42A with RGS4 and GIRK1/4. The rates of rise (kobs) of the resulting current responses have been plotted against the corresponding agonist concentrations and linear fits (solid lines) and their 95% confidence bands (dotted lines) are shown. Experiments were performed using a perfusion rate of 4.5 mL/min. (D) Summary statistics for kon, estimated from the slopes of the linear fits to kobs shown in (A), (B), and (C). Shown are mean kon estimates for DA (WT: 9.70 ± 1.23 × 10⁷ s−1 × M−1, S1935.42A: 3.69 ± 0.48 × 10⁴ s−1 × M−1), (S)-5-OH-DPAT (WT: 2.86 ± 0.31 × 10⁷ s−1 × M−1, S1935.42A: 2.82 ± 0.34 × 10⁶ s−1 × M−1), (R)-5-OH-DPAT (WT: 8.65 ± 1.21 × 10⁵ s−1 × M−1, S1935.42A: 1.95 ± 0.15 × 10⁶ s−1 × M−1), and p-tyramine (WT: 4.94 ± 1.15 × 10³ s−1 × M−1, S1935.42A: 9.41 ± 2.34 × 10³ s−1 × M−1). Note the logarithmic y-axis. (E) Relations between kinetic pKds, derived from koff and kon, and pEC50s, obtained from the concentration–response experiments shown in Figure 1, at WT D2R and S1935.42A. The correlation between pEC50s and kinetic pKds for all four agonists at both WT and S1935.42A mutant D2R was statistically significant (Spearman’s r = 0.9048, p = 0.0046) for all four pairs. Data are presented as mean ± SEM.

